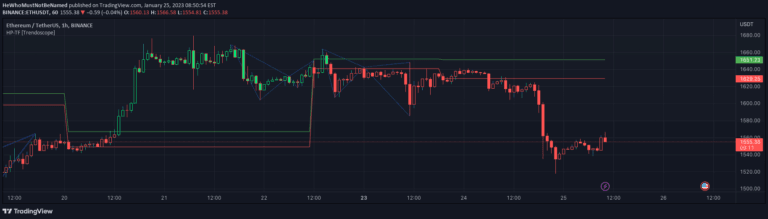
Trend Lines [LuxAlgo]
A dynamic trendline indicator that detects and highlights support/resistance lines in real-time, with customizable filters for angle, length, and break detection across different market conditions.
Explore 11,183 indicators. Filter beyond the obvious.
Discover the tools that fit the way you trade.
11,183 tools to explore
A dynamic trendline indicator that detects and highlights support/resistance lines in real-time, with customizable filters for angle, length, and break detection across different market conditions.
A comprehensive market structure indicator that highlights key support and resistance levels, tracks price interactions, and provides volume insights to help traders understand market dynamics.
A trend-following trading signal that uses harmonic patterns to identify bullish and bearish zones by analyzing price movement across five confirmed pivot points.
A dynamic support and resistance indicator that identifies key price levels using pivot points, tracking market interest zones and providing insights into potential trading opportunities.
A trendline is a technical analysis tool that visually represents market direction by connecting significant price pivots, helping traders identify support, resistance, and potential entry and exit points.
Dynamic Touch Trendlines automatically draw and validate trend lines based on customizable touch requirements, helping traders identify support, resistance, and potential trend reversals.
Pivotal Moments tracks and draws pivot high and low levels on a chart, automatically removing levels when they are touched or crossed in real-time trading.
Advanced technical analysis tool identifying strong support and resistance levels using volume, momentum, and multiple analytical features to help traders make informed market decisions.
An advanced support and resistance indicator that automatically detects and tracks critical price levels using pivot points, touch count, and dynamic grouping for enhanced trading decisions.
A flexible Linear Regression Channel indicator that analyzes market trends using customizable channel analysis with logarithmic scaling and activity-based profiling techniques.
A multi-timeframe candle range analysis tool that visualizes market structure by plotting candle ranges across different timeframes and detecting potential trading opportunities.
A technical indicator that identifies critical price zones where market movement is likely to return, revealing hidden liquidity levels and potential support/resistance areas.
Likes, views, and comments are historical TradingView snapshots. They describe attention, not trading performance.