Liquidity mark-out indicator(by Lumiere)
A trading indicator that marks potential liquidity zones by identifying high and low points using two-candle reversal patterns, helping traders spot key support and resistance levels.
Explore 11,183 indicators. Filter beyond the obvious.
Discover the tools that fit the way you trade.
11,183 tools to explore
A trading indicator that marks potential liquidity zones by identifying high and low points using two-candle reversal patterns, helping traders spot key support and resistance levels.
A trading discipline script that helps traders maintain strategy consistency by creating customizable confirmation checkboxes with color-coded tracking for trade entry criteria.
A comprehensive day trading indicator combining multiple technical analysis tools to generate precise entry and exit signals with multiple layers of market trend confirmation.
An advanced MACD indicator using Holt-Winters smoothing to enhance trend detection and momentum analysis with real-time divergence detection and dynamic ATR-based trailing stops.
A precise trading strategy that identifies liquidity sweeps and potential market reversals by detecting false breakouts beyond recent swing highs or lows using the Inner Circle Trader methodology.
A trading strategy utilizing Fibonacci levels, EMA, and ADX to generate potential buy and sell signals by analyzing price movements and trend strength.
A unique indicator for Gold valuation using base money supply from major global economies to assess whether Gold is overvalued or undervalued relative to market conditions.
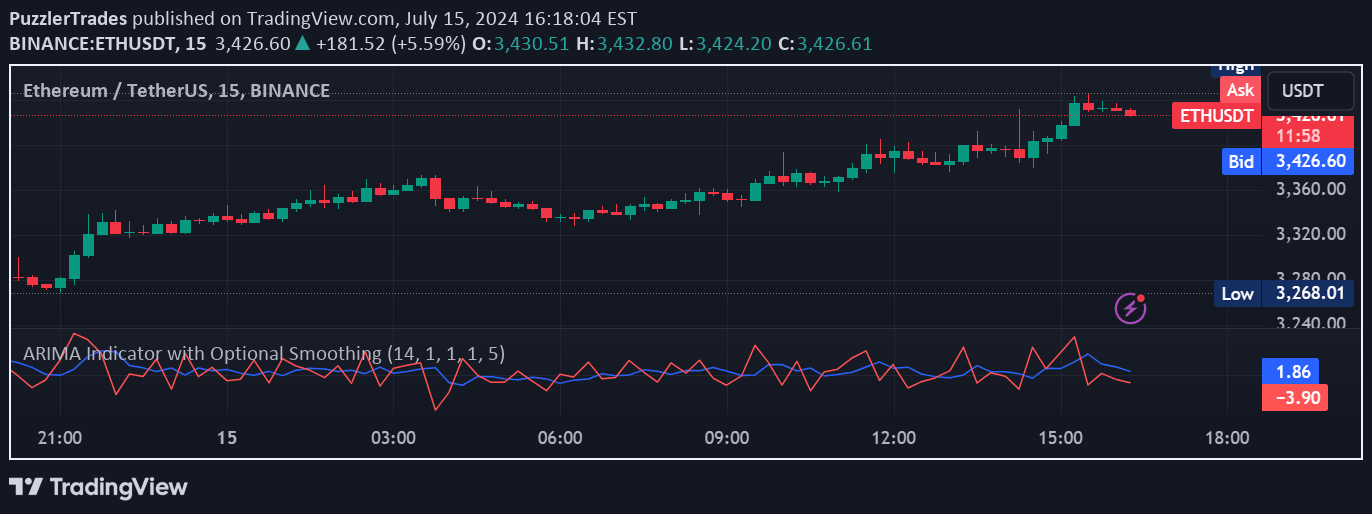
ARIMA Indicator forecasts price movements by analyzing historical data, combining autoregressive and moving average components to predict future trends and potential reversals.
Advanced Fractal and Hurst Indicator combines fractal dimension and Hurst exponent to analyze market trends, providing insights into price movement complexity and persistence.
A novel trend analysis tool using persistent homology to measure trend strength by tracking the persistence and stability of price movements across different market conditions.
A customizable candlestick pattern finder that helps traders identify specific trading opportunities by filtering candles based on volume, volatility, body size, and other advanced metrics.
Multiple MAs is a comprehensive trend analysis tool that overlays six Simple Moving Averages on a price chart, helping traders identify trend direction, support/resistance levels, and potential entry/exit points.
Likes, views, and comments are historical TradingView snapshots. They describe attention, not trading performance.