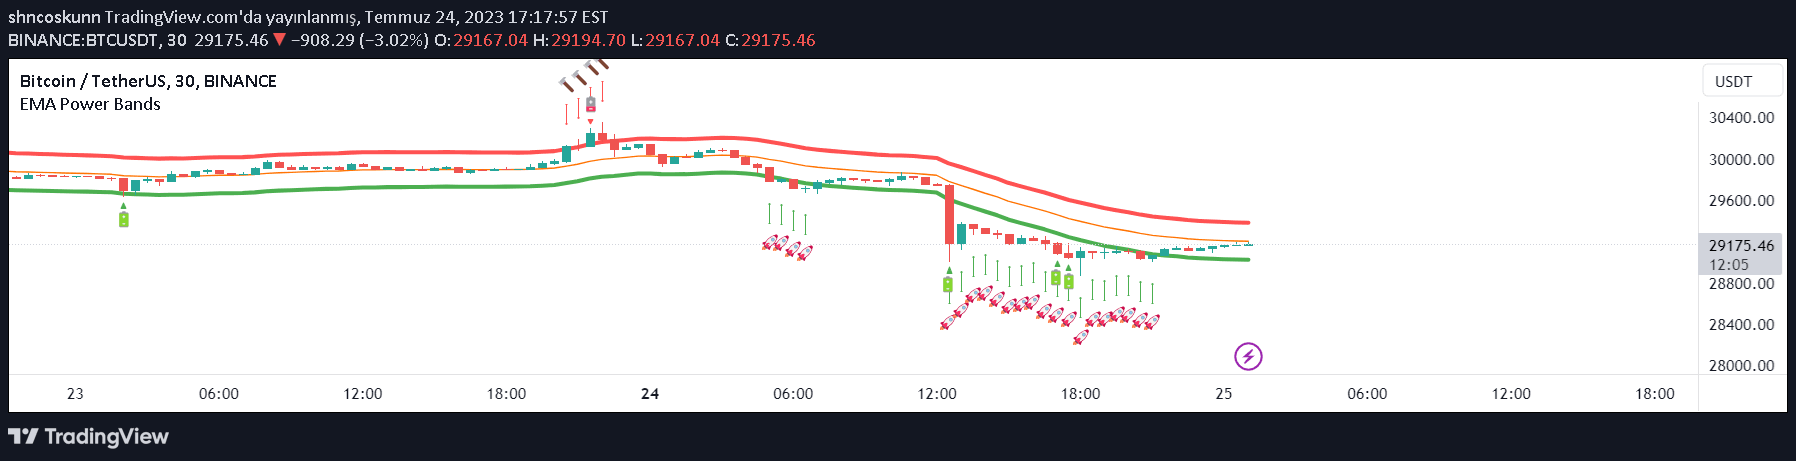
A trading script that uses bar state labels to visually represent market movements through predefined categories like HH, HL, LL, and LH for comprehensive market analysis.
Explore complementary indicator rolesHow it works
The script creates a visual representation of market states using four distinct categories: Higher High (HH), Higher Low (HL), Lower Low (LL), and Lower High (LH). Each category is assigned specific values and plotted as a label on the chart, allowing traders to track price movements and transitions between different market states.
By positioning these labels with precise offsets, the script enables a clear visualization of market dynamics. Traders can quickly identify patterns and transitions in price action, making it easier to understand the underlying market structure and potential trend developments.
Why it may be useful
This visualization technique provides traders with a unique perspective on market movements by breaking down price action into standardized categories. By transforming complex price data into a more digestible format, traders can more easily recognize patterns and potential trend shifts that might be difficult to see in traditional chart representations.
The method allows for quick pattern recognition and helps traders develop a more systematic approach to market analysis. By categorizing price movements into distinct states, traders can build a more structured understanding of market behavior and potentially improve their decision-making process.
When to explore it
This signal is most effective in markets with clear trending or transitional characteristics, where price movements can be distinctly categorized. It works best in timeframes that allow for clear identification of high and low points, such as intraday or short-term trading scenarios where price volatility is more pronounced.
Traders should consider using this method when seeking a more structured approach to market analysis, particularly in markets with identifiable trend patterns. It is especially useful for traders who prefer visual representations of market dynamics and want to develop a more systematic method of tracking price movements and potential trend reversals.
Keep exploring
What we’ve verified
Access, alerts and repainting behaviour have not been independently verified for this indicator. Check the creator’s current publication and settings.
General descriptions and classifications are recovered research. Verified details above identify the specific checks we have completed. Check the creator’s current publication for later changes.