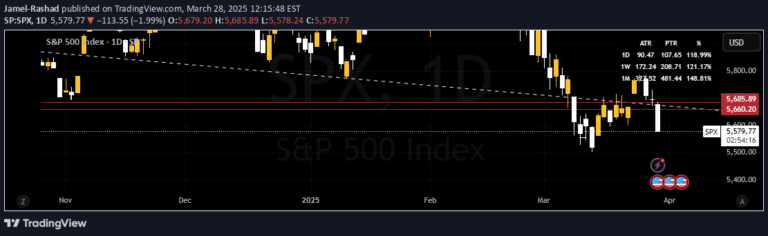
A visual trading tool that highlights recent price extremes by labeling candle highs and lows while providing a real-time OHLCV dashboard for quick market insights.
Explore complementary indicator rolesHow it works
The Candlestick High/Low Labels indicator dynamically annotates recent price candles with red labels above highs and green labels below lows. It uses a configurable lookback period to determine which candles to label, rounding price values for clarity and ensuring easy readability.
Simultaneously, the indicator generates a real-time OHLCV dashboard in the bottom-right corner of the chart. This dashboard displays the last N candles, showing candle number, open, high, low, close, and volume data, providing traders with a comprehensive snapshot of recent market activity.
Why it may be useful
This indicator helps traders quickly identify recent price extremes and potential support/resistance zones without complex calculations or overwhelming visual elements. By presenting clear, concise labels and a compact data dashboard, it enables rapid visual assessment of market structure and recent price behavior.
The tool's simplicity makes it valuable for traders seeking immediate insights into market dynamics. Its ability to highlight key price levels and provide instant OHLCV information can help traders make more informed decisions about potential entry and exit points.
When to explore it
The Candlestick High/Low Labels indicator is most effective in volatile, fast-moving markets where quick visual recognition of price extremes is crucial. It works particularly well for traders focusing on short-term price action and seeking to understand immediate market sentiment and momentum.
Traders can leverage this tool during active trading sessions, especially in markets with significant price movement such as forex, cryptocurrency, and high-volume stock markets. It's especially useful for scalpers and day traders who need rapid, clear visual feedback on recent price behavior.
Keep exploring
What we’ve verified
Access, alerts and repainting behaviour have not been independently verified for this indicator. Check the creator’s current publication and settings.
General descriptions and classifications are recovered research. Verified details above identify the specific checks we have completed. Check the creator’s current publication for later changes.