
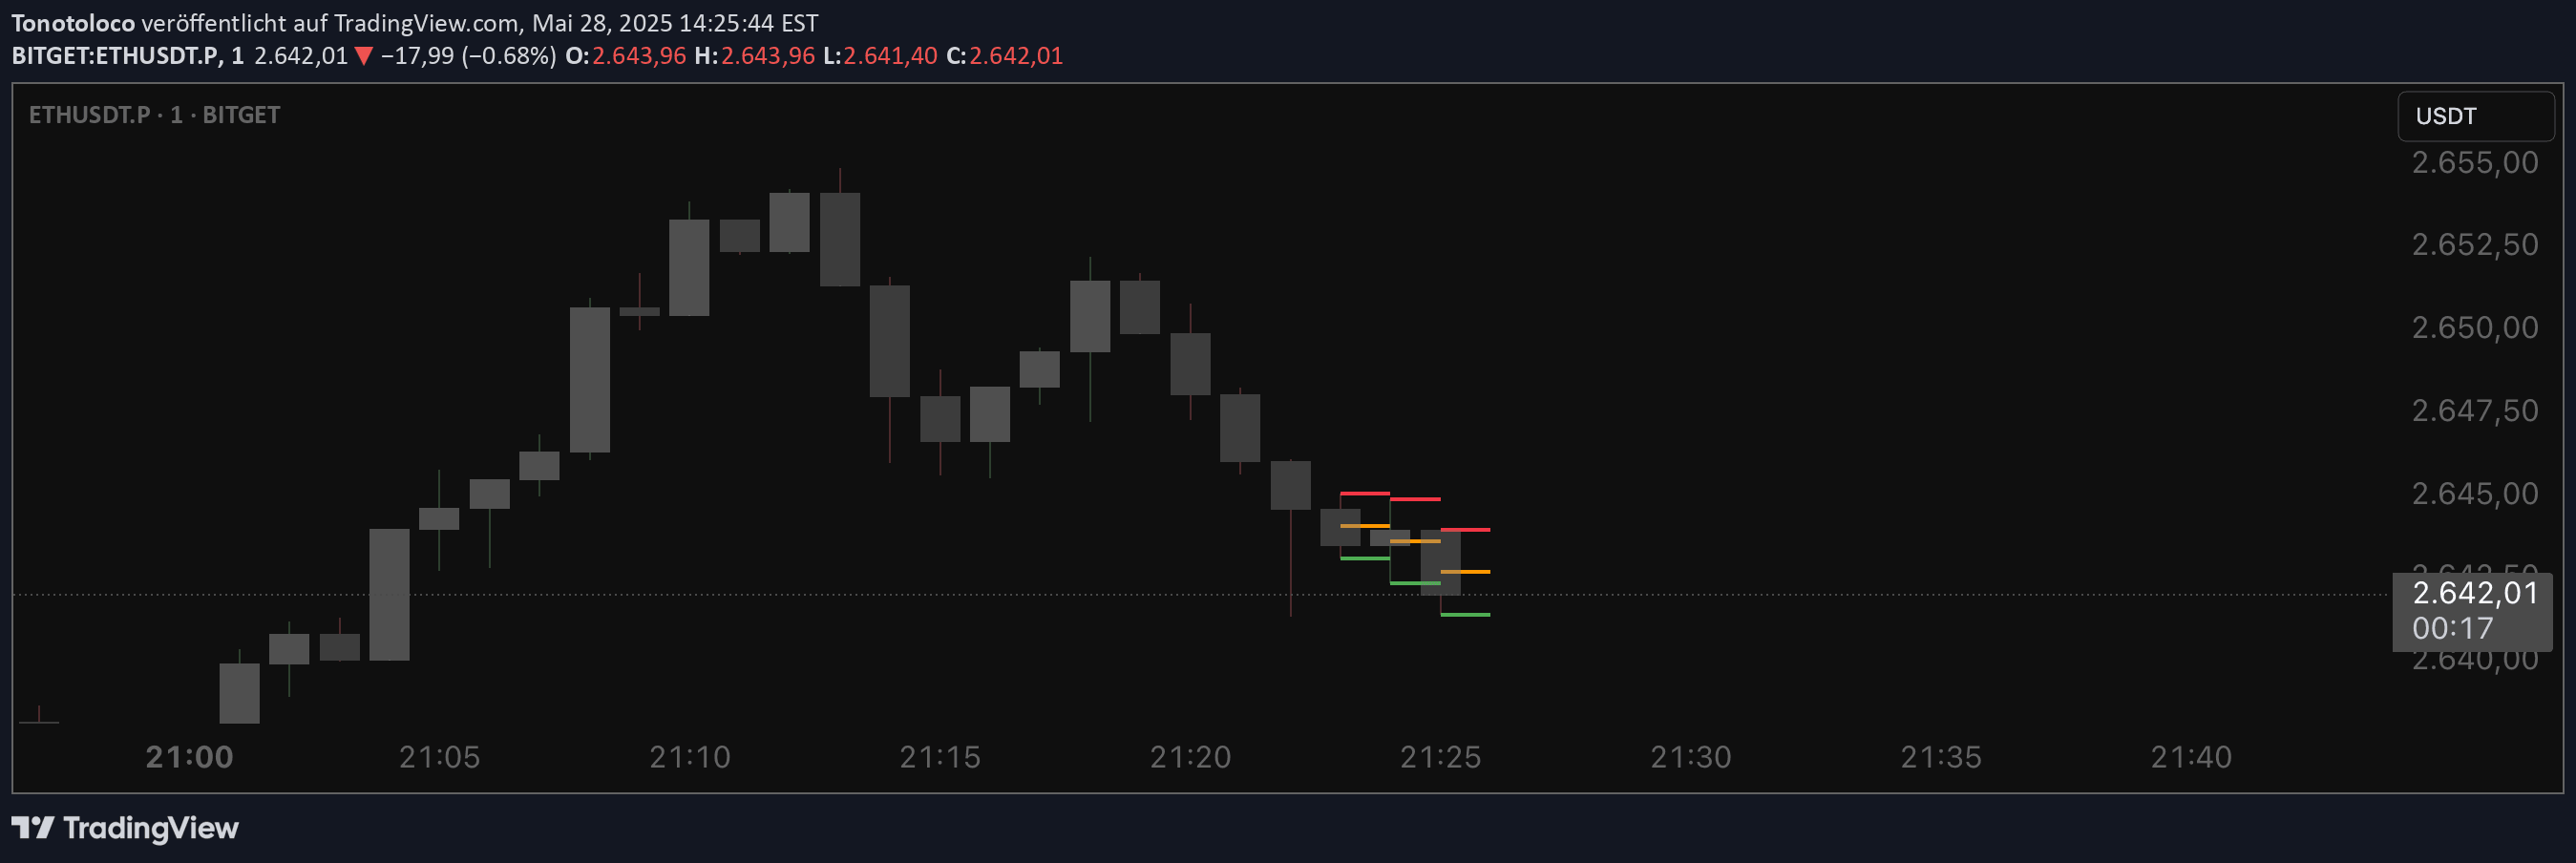
A flexible tool for tracking recent price extremes by displaying high and low values of the last 1-3 candles, which updates dynamically with each new candle.
Explore complementary indicator rolesHow it works
This signal operates by continuously tracking and displaying the highest and lowest price points of recent candles, allowing traders to select between 1, 2, or 3 candle periods. The visualization updates automatically with each new candle formation, providing real-time price extreme information directly on the chart.
Traders can customize the display by toggling specific lines on or off and adjusting their color preferences. This flexibility enables users to adapt the indicator to their specific trading style and visual preferences, making it a versatile tool for monitoring recent price action.
Why it may be useful
By highlighting recent price extremes, this signal helps traders quickly identify key support and resistance levels within recent market movements. It provides an immediate visual reference for recent price ranges, which can be crucial for understanding short-term market dynamics and potential entry or exit points.
The customizable nature of the indicator allows traders to tailor the display to their specific needs, making it a valuable tool for both technical analysis and quick market assessment. Its real-time updates ensure that traders always have the most current information about recent price fluctuations.
When to explore it
This signal is most effective during periods of active market movement where tracking recent price extremes can provide quick insights into market sentiment and potential trend changes. It is particularly useful in volatile markets where short-term price fluctuations are significant and rapid.
Traders should consider using this signal during day trading and scalping scenarios, where understanding recent price ranges can help make quick, informed trading decisions. It is especially valuable in markets with high liquidity and frequent price movements, such as forex, cryptocurrency, and actively traded stock markets.
Keep exploring
What we’ve verified
Access, alerts and repainting behaviour have not been independently verified for this indicator. Check the creator’s current publication and settings.
General descriptions and classifications are recovered research. Verified details above identify the specific checks we have completed. Check the creator’s current publication for later changes.


