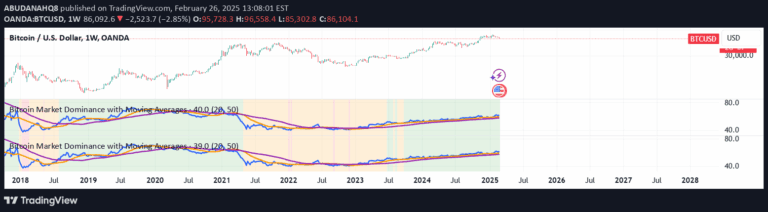
A Bitcoin investment tool using a 200-week moving average heatmap to identify potential market cycle bottoms and tops by tracking percentage changes over time.
Explore complementary indicator rolesHow it works
The 200-week moving average heatmap tracks changes in Bitcoin's long-term price trajectory by comparing the current 200-week simple moving average (SMA) to its value from four weeks prior. It generates a color-coded visualization representing the percentage delta between these two points, creating a heat map that indicates price momentum and potential trend shifts.
The indicator produces a score ranging from -1 to 1, which helps investors understand the current market positioning. By analyzing these color-coded changes, traders can identify potential market cycle bottoms and tops, providing insights into Bitcoin's broader price movements beyond short-term fluctuations.
Why it may be useful
This indicator is crucial for long-term Bitcoin investors seeking to understand market cycles and potential entry or exit points. By highlighting historical price behavior around the 200-week moving average, it offers a strategic perspective on Bitcoin's price movements that goes beyond day-to-day volatility.
The heatmap provides a visual representation of market trends, helping investors make more informed decisions based on historical price patterns. It transforms complex price data into an easily interpretable format, allowing both experienced and novice investors to gauge market sentiment and potential turning points.
When to explore it
The 200-week moving average heatmap is most effective for long-term investors and those interested in understanding Bitcoin's broader market cycles. It is particularly useful during significant market transitions, such as potential bear market bottoms or bull market beginnings, where historical price patterns become more relevant.
Investors should use this tool in conjunction with other analysis methods, treating it as a complementary indicator rather than a standalone decision-making metric. It is most valuable when examining multi-year trends and seeking to identify potential long-term investment opportunities in the cryptocurrency market.
Keep exploring
What we’ve verified
Access, alerts and repainting behaviour have not been independently verified for this indicator. Check the creator’s current publication and settings.
General descriptions and classifications are recovered research. Verified details above identify the specific checks we have completed. Check the creator’s current publication for later changes.