
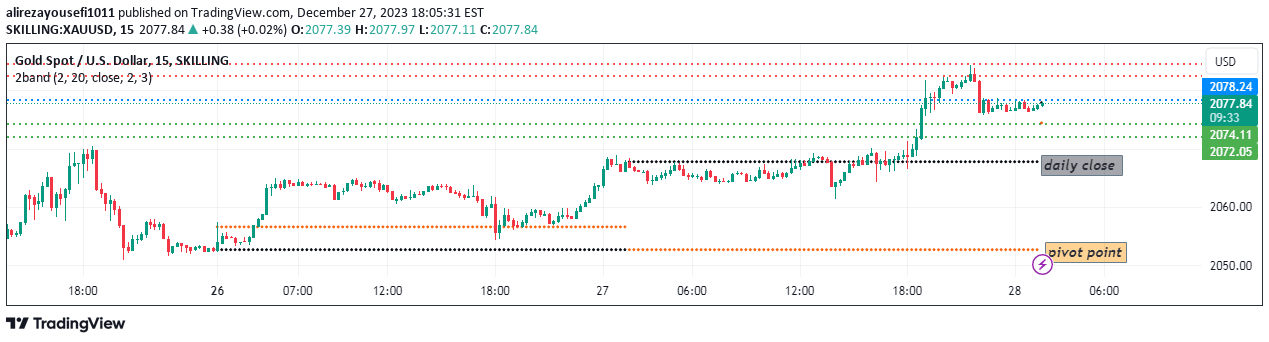
A custom trading indicator using multiple bands with a 20-period moving average, designed to help identify potential price targets and support/resistance levels across different timeframes.
Explore complementary indicator rolesHow it works
The indicator creates multiple bands around a 20-period moving average, with upper and lower lines representing resistance and support levels. The blue centerline shows the average price of the previous 20 candles, while two additional bands are plotted with different deviations to highlight potential price targets.
Traders can use these bands to identify potential entry and exit points by observing price interactions with the different lines. When the price closes above or below the blue moving average line, the corresponding upper or lower bands can be used as potential price targets.
Why it may be useful
This indicator provides traders with a comprehensive visual tool for understanding price dynamics and potential market movements. By presenting multiple levels of support, resistance, and average price, it helps traders make more informed decisions about market trends and potential price trajectories.
The multi-band approach allows traders to see different levels of market structure, giving insights into potential price targets and helping to manage risk by providing clear reference points for trade entry and exit strategies.
When to explore it
The indicator is most effective on timeframes of 30 minutes or higher, offering more reliable signals for longer-term trading strategies. It works best in markets with clear trending characteristics, where price tends to respect support and resistance levels.
Traders should use this indicator in conjunction with other technical analysis tools to confirm signals and validate potential trade setups. It is particularly useful for identifying potential price targets and understanding the overall market structure across different trading timeframes.
Keep exploring
What we’ve verified
Access, alerts and repainting behaviour have not been independently verified for this indicator. Check the creator’s current publication and settings.
General descriptions and classifications are recovered research. Verified details above identify the specific checks we have completed. Check the creator’s current publication for later changes.


