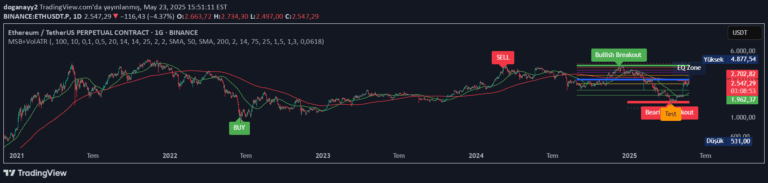
A Donchian Channel indicator that identifies market volatility and potential breakout opportunities by plotting dynamic bands and analyzing channel width and slope.
Explore complementary indicator rolesHow it works
The Donchian Channel indicator calculates the highest high and lowest low over a specified lookback period, creating upper and lower bands that dynamically track price movements. These bands automatically adjust to market conditions, expanding during volatile periods and contracting during low-volatility consolidation phases.
The indicator includes additional contextual features like midline slope detection and color-coded shading to help traders quickly interpret market dynamics. By monitoring the width and color of the channels, traders can identify potential breakout setups and understand the current trend direction.
Why it may be useful
Donchian Channels provide traders with a powerful visual tool for understanding market volatility and potential trend changes. By displaying the highest and lowest price points over a defined period, the indicator helps traders recognize key support and resistance levels and potential breakout opportunities.
The enhanced version with dynamic shading and volatility filtering offers traders more nuanced insights into market conditions. This allows for more informed decision-making by providing clear visual cues about trend direction, volatility compression, and potential entry points.
When to explore it
The Donchian Channel indicator is most effective during periods of market consolidation and potential trend transitions. Traders can use it to identify low-volatility zones that often precede significant price movements, helping to anticipate potential breakout scenarios.
It works particularly well when combined with other momentum or volume indicators to confirm trading signals. Traders should pay special attention to moments when the channel width narrows and then begins to expand, as these can signal potential trend continuation or reversal opportunities.
Keep exploring
What we’ve verified
Access, alerts and repainting behaviour have not been independently verified for this indicator. Check the creator’s current publication and settings.
General descriptions and classifications are recovered research. Verified details above identify the specific checks we have completed. Check the creator’s current publication for later changes.