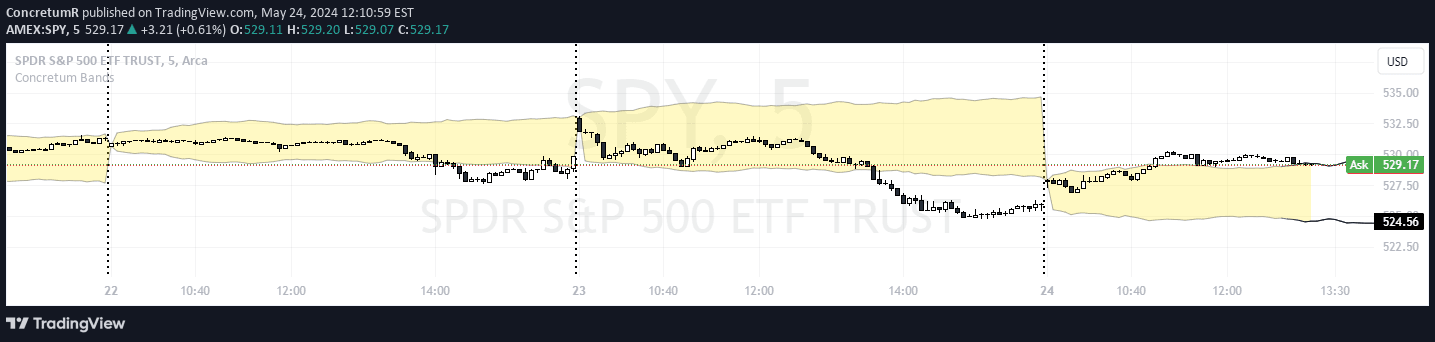
A technical indicator defining an intraday noise area based on historical price movements, identifying potential significant price imbalances and trend initiation points.
Explore complementary indicator rolesHow it works
The Concretum Bands indicator calculates upper and lower price boundaries by analyzing the average absolute price movement over a specified lookback period, typically 14 days. It starts with the day's opening price and adds or subtracts the average historical move, creating a dynamic noise area that represents expected intraday price fluctuations.
The bands are further refined by accounting for overnight price gaps and can be adjusted using a volatility multiplier to expand or contract their width. This approach allows traders to dynamically visualize a price range where normal market movement is expected, providing a clear visual reference for potential significant price shifts.
Why it may be useful
The Concretum Bands offer traders a data-driven approach to understanding intraday price dynamics by quantifying expected market movement based on recent historical performance. By establishing a statistically derived noise area, traders can more objectively assess when price movements represent normal market behavior versus potential trend-initiating events.
This indicator helps reduce emotional decision-making by providing a systematic framework for identifying meaningful price breaks. Traders can use these bands to recognize potential momentum shifts, manage risk more effectively, and develop more disciplined entry and exit strategies during intraday trading.
When to explore it
The Concretum Bands are most effective in liquid, high-volume markets with consistent intraday price movements, such as major stock indices, ETFs, and actively traded individual stocks. They work best in markets with relatively stable volatility and during regular trading hours when price discovery is most active.
Traders should be cautious during periods of extreme market events, low liquidity, or significant news-driven volatility, as these conditions can cause price movements that deviate substantially from historical patterns. The indicator is particularly useful for short-term traders seeking to capitalize on momentum shifts and identify potential trend initiation points within a single trading session.
Keep exploring
What we’ve verified
Access, alerts and repainting behaviour have not been independently verified for this indicator. Check the creator’s current publication and settings.
General descriptions and classifications are recovered research. Verified details above identify the specific checks we have completed. Check the creator’s current publication for later changes.