
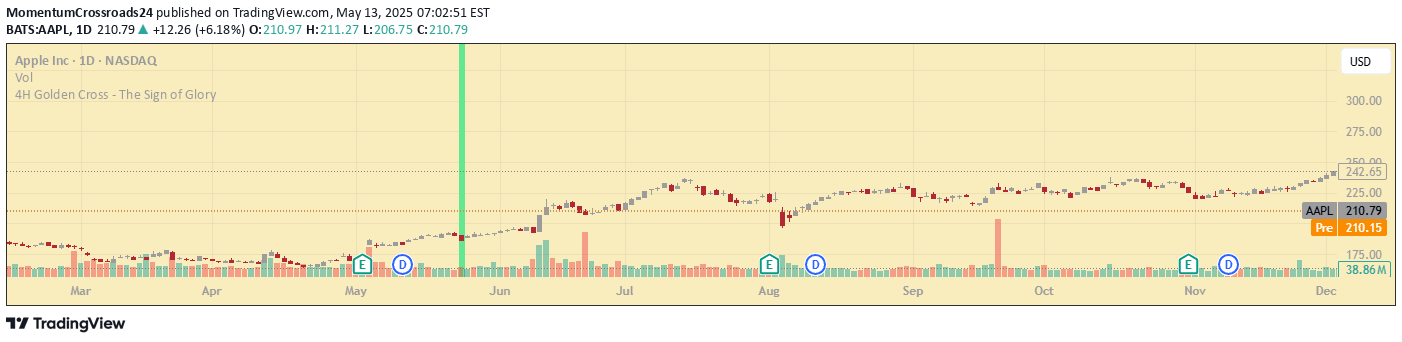
A golden cross indicator that calculates the crossover on a 4-hour timeframe and visually highlights the signal across different chart timeframes for easy tracking.
Explore complementary indicator rolesHow it works
The golden cross indicator tracks the intersection of two moving averages on the 4-hour timeframe, specifically identifying when a short-term moving average crosses above a long-term moving average. This crossover is considered a bullish signal that suggests potential upward momentum in the market.
Once the golden cross is detected, the indicator automatically draws a green vertical beam or line on the exact bar where the crossover occurred. This visual marker remains consistent across different chart timeframes, allowing traders to quickly identify the golden cross signal without manually switching between time intervals.
Why it may be useful
The golden cross is a significant technical analysis tool that helps traders identify potential trend reversals and bullish momentum in financial markets. By highlighting the moment when shorter-term price trends overcome longer-term trends, it provides traders with a clear visual signal of changing market dynamics.
This indicator's unique ability to display the signal across multiple timeframes makes it particularly valuable for traders who want to maintain a comprehensive view of market movements. The green vertical beam serves as an immediate, unmistakable marker of a potentially important trend shift.
When to explore it
The golden cross indicator is most effective in trending markets where clear directional movements are present, particularly in stocks, indices, and major currency pairs. Traders should use this signal as part of a broader analysis that includes other technical and fundamental indicators to confirm potential trend changes.
It is especially useful for day traders and swing traders looking to identify potential entry points during emerging bullish trends. However, traders should be cautious and not rely solely on this signal, as false signals can occur in choppy or range-bound markets.
Keep exploring
What we’ve verified
Access, alerts and repainting behaviour have not been independently verified for this indicator. Check the creator’s current publication and settings.
General descriptions and classifications are recovered research. Verified details above identify the specific checks we have completed. Check the creator’s current publication for later changes.


