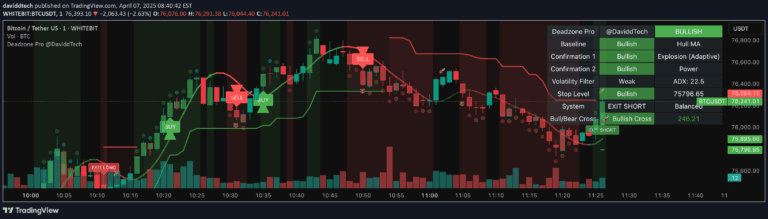
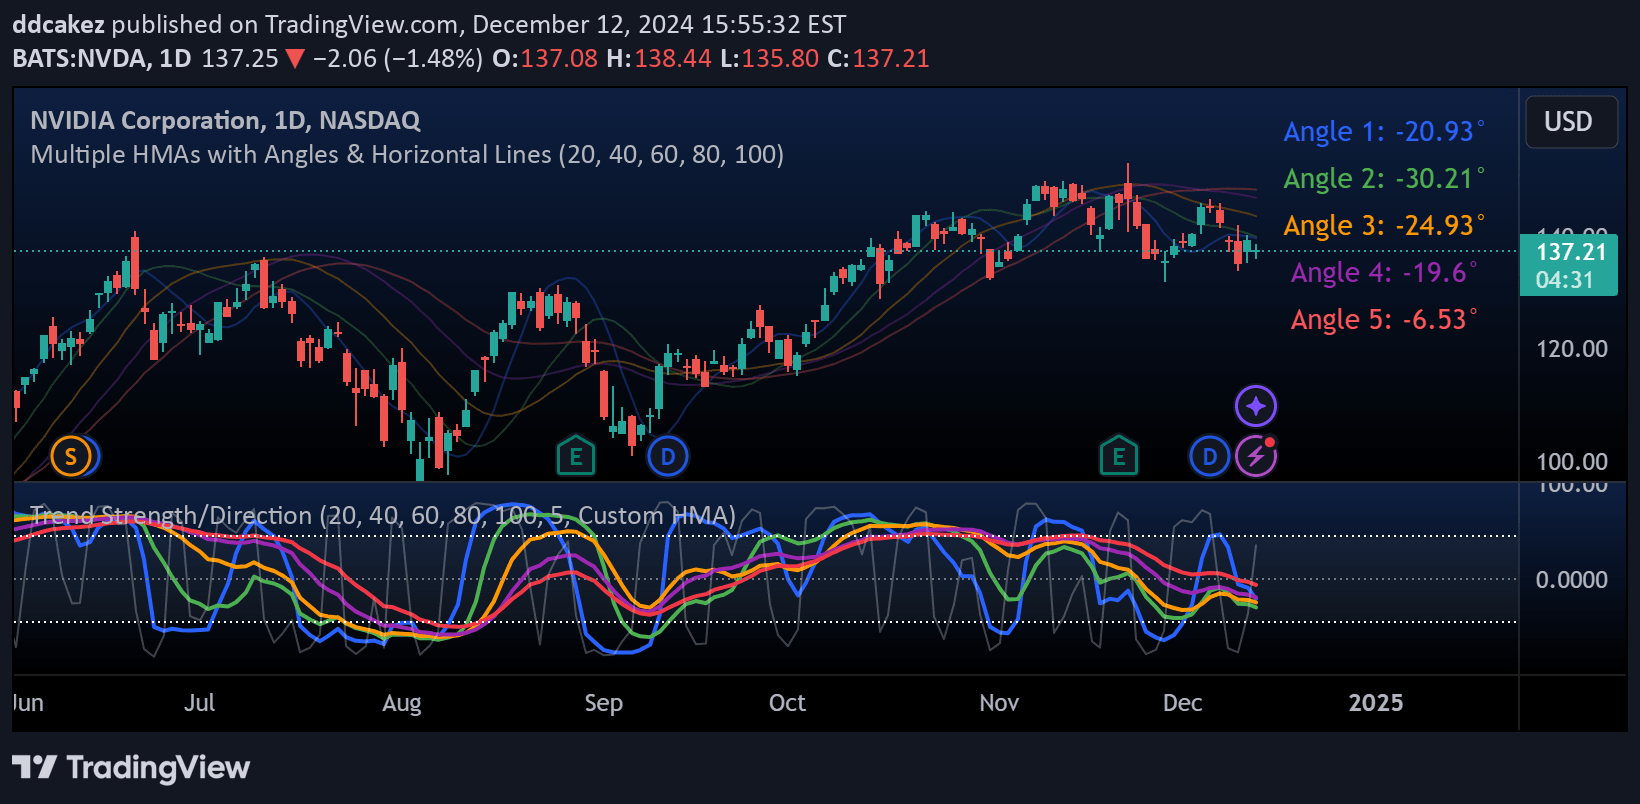
A technical candle alert indicator that identifies trading signals by analyzing multiple technical indicators like MFI, RSI, Stochastics, and EMA crossovers to help traders spot potential market opportunities.
Explore complementary indicator rolesHow it works
The Technical Candle Alert indicator analyzes multiple technical indicators simultaneously to generate trading signals. It automatically identifies the strongest trend period and uses that as its lookback length, examining max and min values of various technical indicators like MFI, RSI, and Stochastics.
The indicator tracks EMA 50 and EMA 200 to detect golden and death crosses, which are critical trend reversal signals. It also monitors pivot points and provides customizable alerts directly over the trading candle when specific technical conditions are met, allowing traders to quickly identify potential trading opportunities.
Why it may be useful
This indicator provides traders with a comprehensive, multi-dimensional view of market conditions by consolidating several technical analysis tools into a single, easy-to-read signal. By combining different technical indicators, it offers a more robust approach to identifying potential trading opportunities compared to relying on a single indicator.
The flexibility to customize alert settings, adjust technical parameters, and choose signal frequency makes this tool adaptable to various trading styles and risk tolerances. Traders can fine-tune the indicator to match their specific trading strategy, making it a versatile tool for different market conditions and timeframes.
When to explore it
The Technical Candle Alert indicator is most effective in markets with clear trend movements and sufficient price volatility. It works best when traders want a comprehensive overview of multiple technical indicators simultaneously, helping to confirm potential entry and exit points across different trading timeframes.
This indicator is particularly useful during periods of market transition, such as when price is approaching key support or resistance levels, or when there are potential trend reversals signaled by EMA crossovers. Traders should combine these signals with other forms of analysis and risk management strategies to make well-informed trading decisions.
Keep exploring
What we’ve verified
Access, alerts and repainting behaviour have not been independently verified for this indicator. Check the creator’s current publication and settings.
General descriptions and classifications are recovered research. Verified details above identify the specific checks we have completed. Check the creator’s current publication for later changes.