
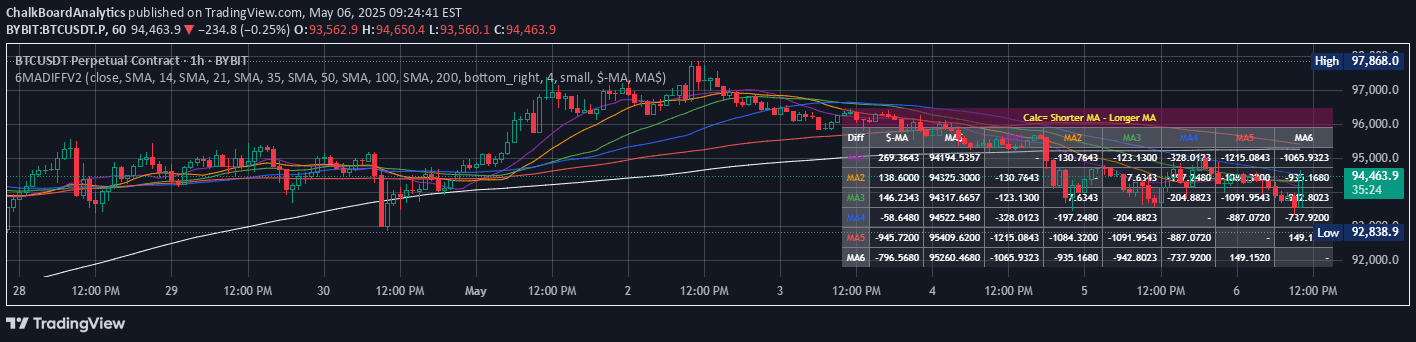
A comprehensive moving average indicator that calculates multiple MA types and generates a detailed comparison table showing relationships between different moving averages and current price.
Explore complementary indicator rolesHow it works
The 6 Moving Averages Difference Table calculates up to six distinct moving averages using a user-selected price input source. Each moving average can be customized by type (SMA, EMA, WMA, etc.), length, and color, providing traders with extensive flexibility in technical analysis.
The indicator generates a data table that displays the absolute difference between the current price and each moving average, the actual MA price values, and a matrix comparing the differences between each MA pair. This comprehensive approach allows traders to quickly assess the relationship between multiple moving averages on a single chart.
Why it may be useful
Moving averages are crucial tools for understanding market trends and potential support/resistance levels. By presenting multiple moving averages simultaneously, traders can gain deeper insights into price momentum, trend strength, and potential market transitions.
The indicator's unique table format provides a quantitative snapshot of MA relationships, enabling traders to make more informed decisions about market direction. It helps visualize the convergence and divergence of different moving averages, which can signal potential trend changes or confirm existing market movements.
When to explore it
This indicator is most effective in markets with clear trending characteristics, where multiple moving averages can help confirm and validate trend directions. It works well across various timeframes, from short-term scalping to longer-term swing trading, making it a versatile tool for different trading strategies.
Traders should use this indicator when they want a comprehensive view of price movement relative to different moving average types and lengths. It is particularly useful during market transitions, when comparing short-term and long-term trends, or when seeking to identify potential trend reversals or continuations.
Keep exploring
What we’ve verified
Access, alerts and repainting behaviour have not been independently verified for this indicator. Check the creator’s current publication and settings.
General descriptions and classifications are recovered research. Verified details above identify the specific checks we have completed. Check the creator’s current publication for later changes.


