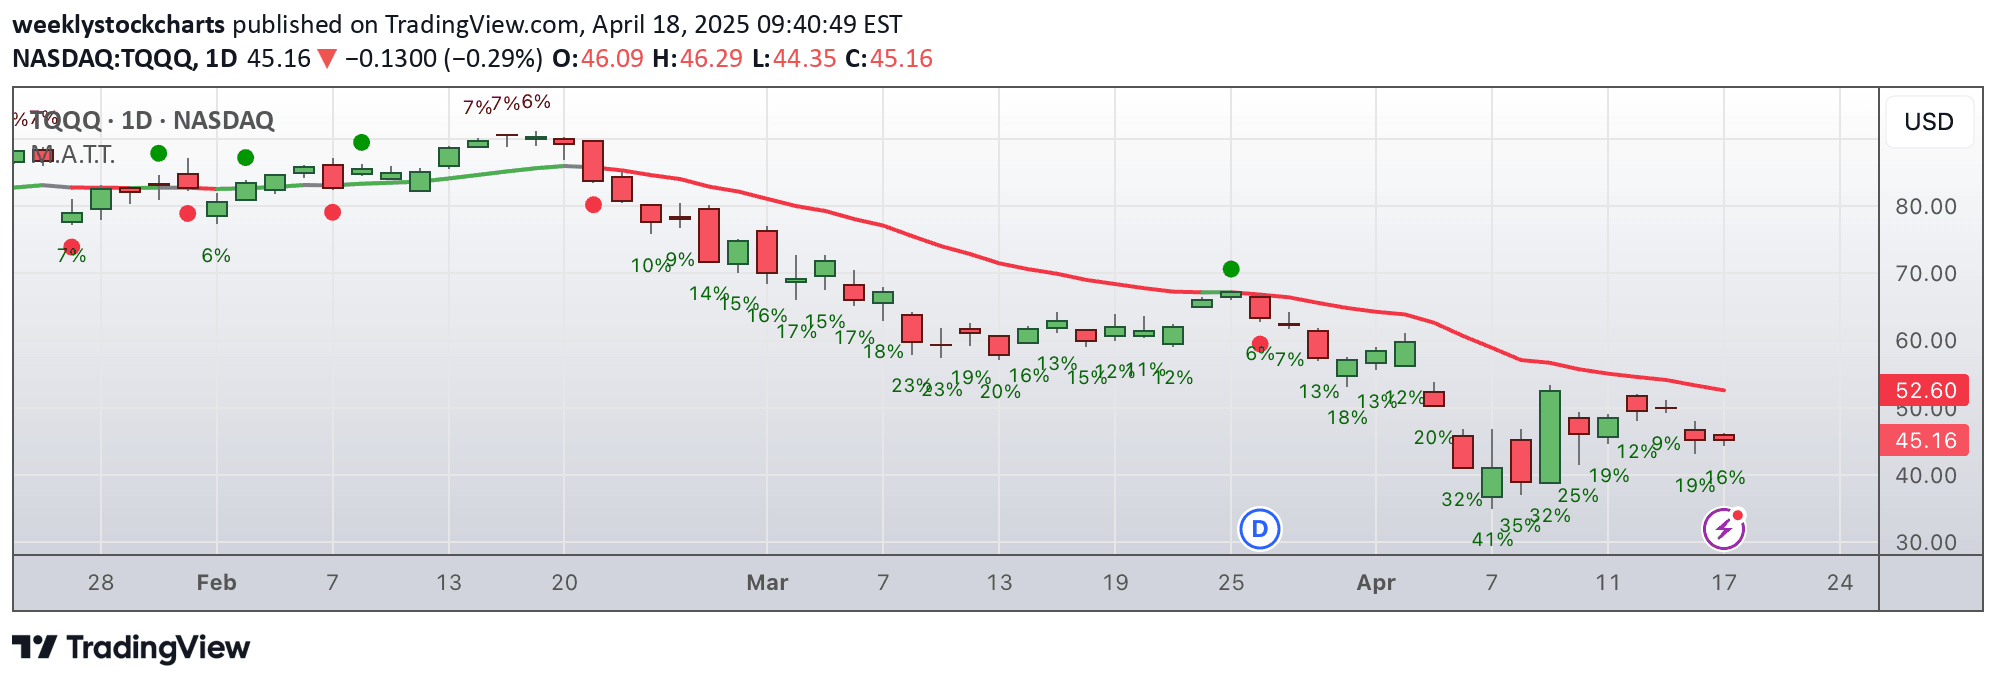
A multi-layered moving average system using three different time horizons to analyze market trends, providing dynamic insights into price momentum and trend direction.
Explore complementary indicator rolesHow it works
The Triple Differential Moving Average Braid integrates three moving average layers with distinct time horizons: Silver Thread (21D), Royal Guard (50D/200D), and Golden Section (50D/200D). Each layer combines Simple Moving Averages (SMAs) and Exponential Moving Averages (EMAs) to capture different aspects of market momentum.
The system uses color-coded shading to visually represent trend strength, with faster moving averages providing leading signals and slower averages confirming broader market structures. When these layers align, they create a comprehensive view of market trends across short, medium, and long-term perspectives.
Why it may be useful
Traditional moving average indicators often provide limited insights by focusing on single timeframes or crossover events. This multi-layered approach offers traders a more nuanced understanding of market dynamics, revealing potential trend shifts and momentum changes with greater precision.
By integrating different moving average types and periods, traders can distinguish between temporary pullbacks and significant trend reversals, reducing the likelihood of premature trade exits and improving overall decision-making processes.
When to explore it
The Triple Differential Moving Average Braid is most effective during trending market conditions, particularly for swing traders seeking to capture extended price movements. It performs best in markets with clear directional bias, where multiple moving average layers can provide consistent and reliable signals.
Traders should pay special attention when layers start to diverge, as these moments often indicate potential trend transitions or significant market structure changes. The indicator is particularly valuable when confirming trend continuation or identifying potential entry and exit points in longer-term trading strategies.
Keep exploring
What we’ve verified
Access, alerts and repainting behaviour have not been independently verified for this indicator. Check the creator’s current publication and settings.
General descriptions and classifications are recovered research. Verified details above identify the specific checks we have completed. Check the creator’s current publication for later changes.