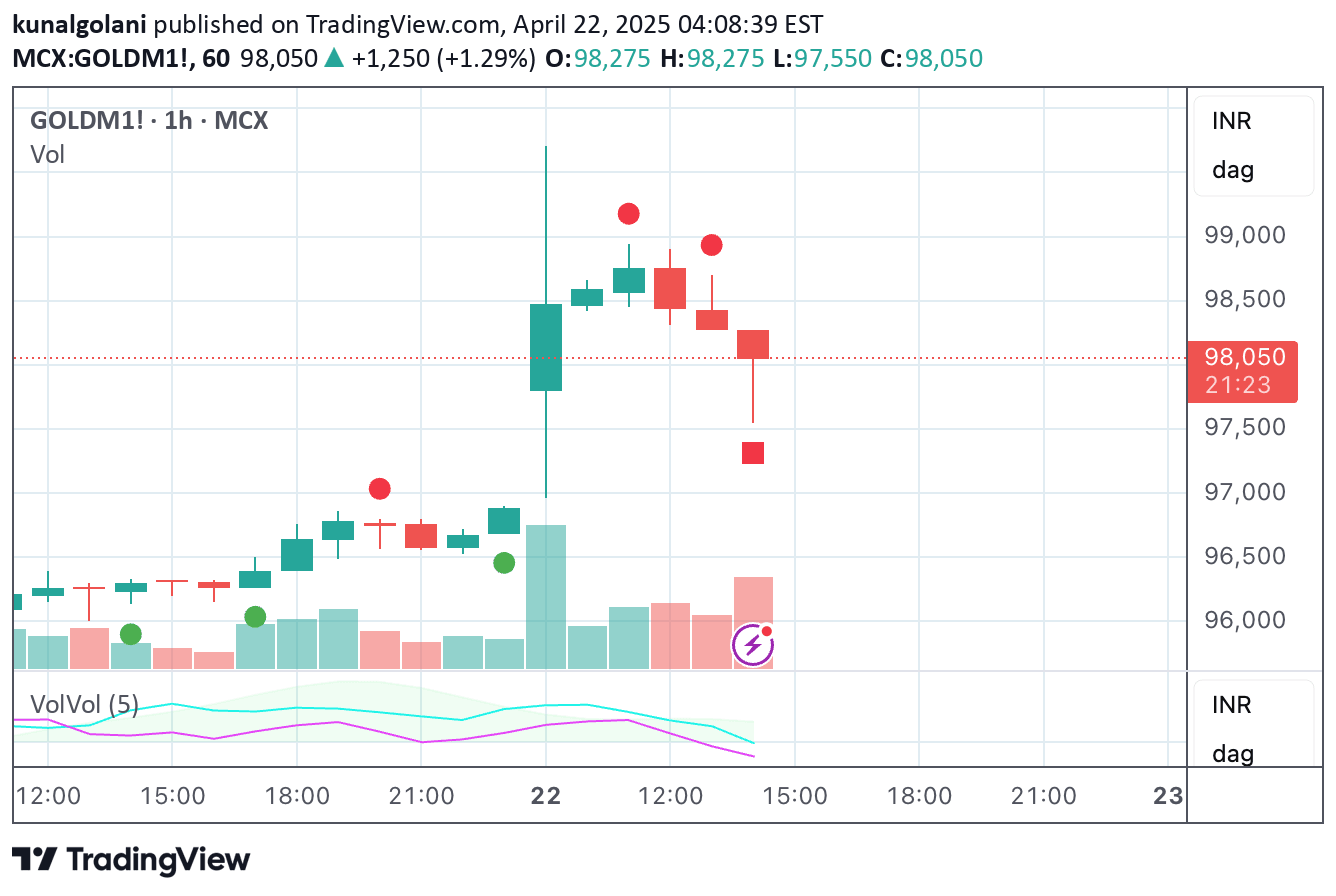
NR7 identifies the narrowest trading range in seven days, signaling potential market consolidation and possible upcoming price breakout with low volatility.
Explore complementary indicator rolesHow it works
The NR7 pattern is calculated by comparing the daily trading ranges over the past seven trading sessions to identify the narrowest range day. Traders look for a day where the price range (high minus low) is the smallest within this seven-day window, which indicates a period of extremely low volatility and potential market compression.
When an NR7 pattern is identified, it suggests that market participants are experiencing reduced price movement and uncertainty. This compression often precedes a significant price movement, as the market tends to build up potential energy during periods of tight trading ranges before releasing that energy through a breakout.
Why it may be useful
The NR7 pattern is significant because it highlights moments of market consolidation that can signal potential substantial price movements. By identifying these periods of low volatility, traders can prepare for possible breakout scenarios and adjust their trading strategies accordingly.
This pattern provides valuable insight into market psychology, revealing times when traders are uncertain and price action is constrained. Recognizing these moments can help traders anticipate potential trend reversals or continuations, offering a strategic advantage in timing entry and exit points.
When to explore it
The NR7 pattern works best in markets with clear trend potential and when used in conjunction with other technical analysis tools. Traders should look for this pattern in liquid markets with consistent trading volumes, such as major stock indices, forex pairs, and actively traded commodities.
It is most effective when combined with additional confirmation signals like trend indicators, momentum oscillators, or volume analysis. Traders should be cautious and wait for a clear breakout following the NR7 pattern, using stop-loss orders to manage potential false signals and protect against unexpected market movements.
Keep exploring
What we’ve verified
Access, alerts and repainting behaviour have not been independently verified for this indicator. Check the creator’s current publication and settings.
General descriptions and classifications are recovered research. Verified details above identify the specific checks we have completed. Check the creator’s current publication for later changes.