
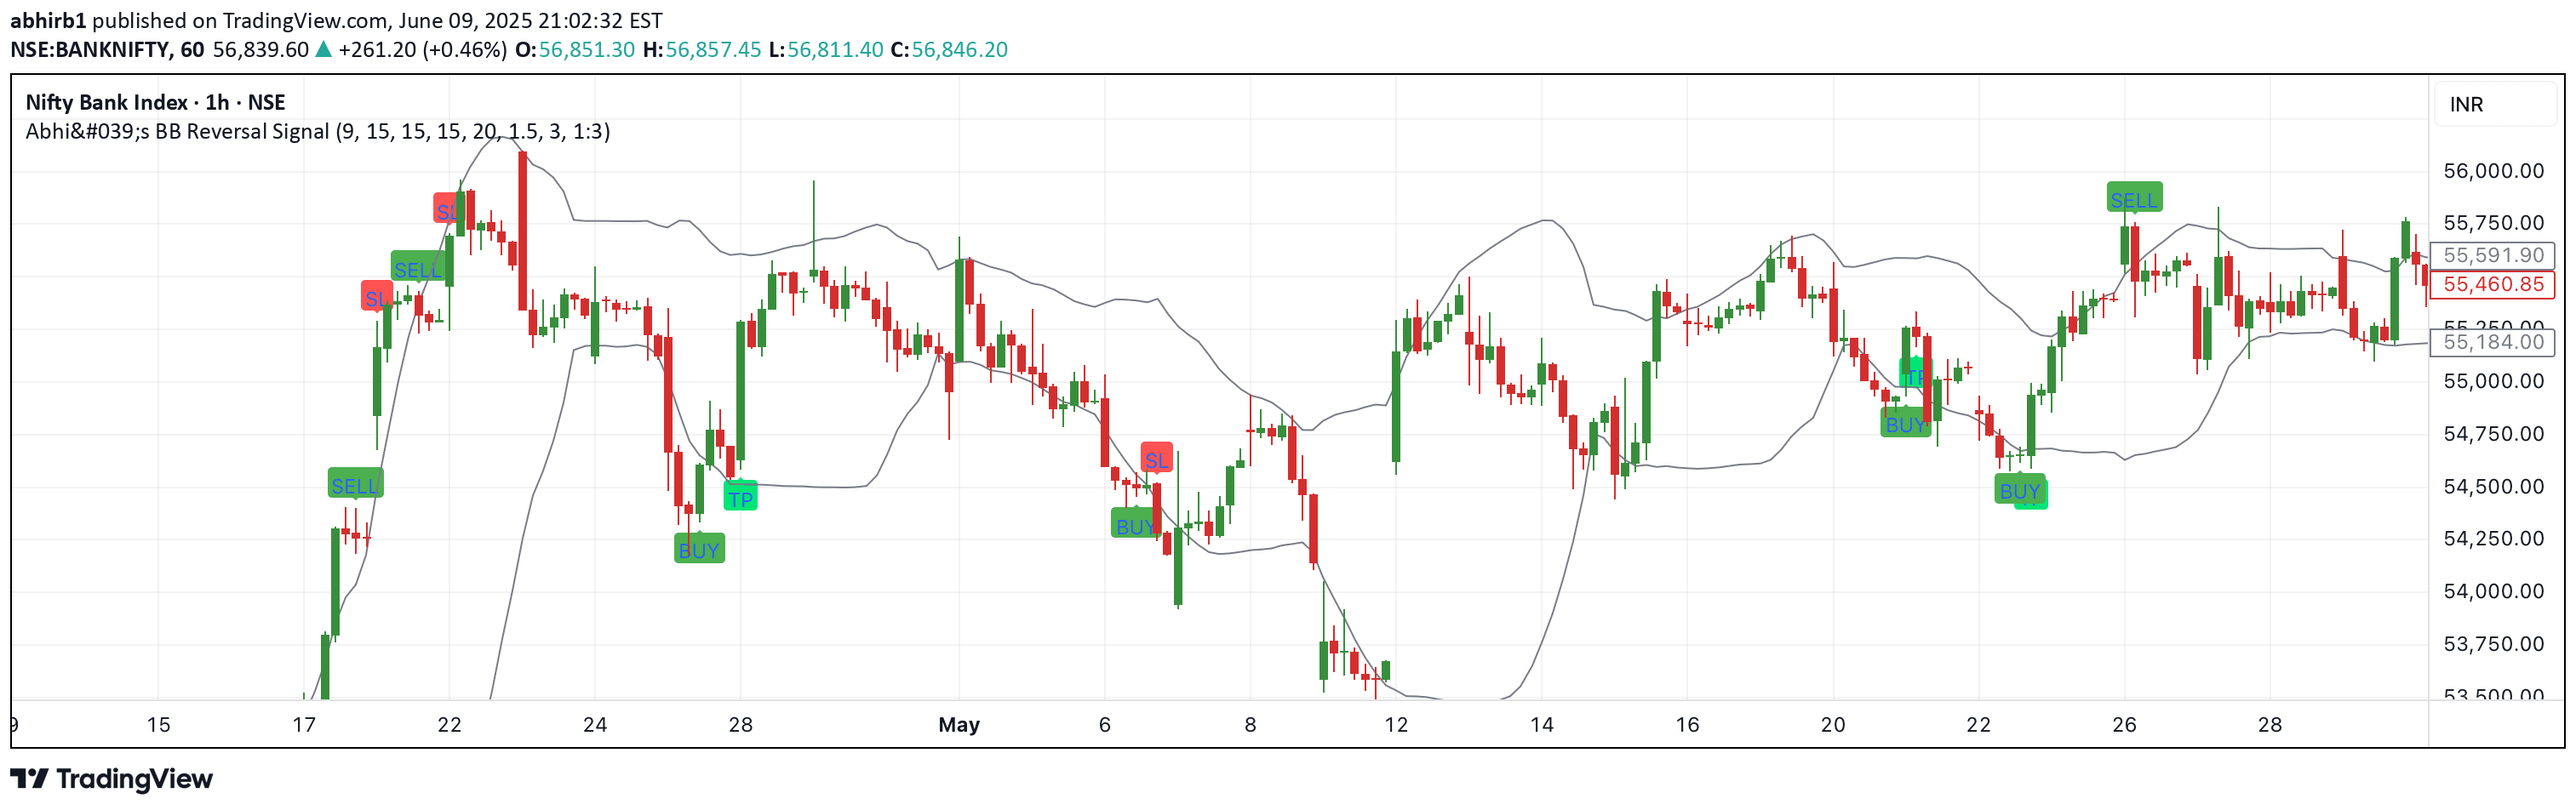
A Pine Script indicator using Bollinger Band breakouts to detect potential market reversals with precise entry, stop-loss, and target conditions for intraday trading.
Explore complementary indicator rolesHow it works
The indicator uses Bollinger Bands to identify potential market reversal points by analyzing price action around the upper and lower bands. For sell signals, it requires the previous candle to close above the upper band with its entire body above, and the current candle to fail breaking the previous high while breaking below the previous low.
For buy signals, the process is reversed, with the previous candle closing below the lower band and the current candle breaking above the previous high. Entry points are precisely defined at the previous candle's high or low, with corresponding stop-loss levels set at the opposite extreme of that candle.
Why it may be useful
This indicator provides traders with a systematic approach to identifying potential market reversals, reducing emotional decision-making and offering clear, rule-based entry and exit strategies. By utilizing Bollinger Bands and specific price action conditions, traders can develop a more disciplined and structured trading methodology.
The signal's strength lies in its ability to combine volatility analysis with precise entry conditions, helping traders capitalize on potential trend reversals while managing risk through predefined stop-loss and take-profit levels.
When to explore it
The Bollinger Band reversal strategy is most effective in markets with clear directional movements and moderate volatility, such as liquid forex pairs, major stock indices, or actively traded commodities. It performs best during periods of consistent price trends where bands can accurately represent market dynamics.
Traders should be cautious during extremely low-volatility periods or during major economic announcements when price movements might become unpredictable. The indicator is particularly suited for intraday and scalping timeframes, where quick, decisive price actions can be more readily identified and traded.
Keep exploring
What we’ve verified
Access, alerts and repainting behaviour have not been independently verified for this indicator. Check the creator’s current publication and settings.
General descriptions and classifications are recovered research. Verified details above identify the specific checks we have completed. Check the creator’s current publication for later changes.


