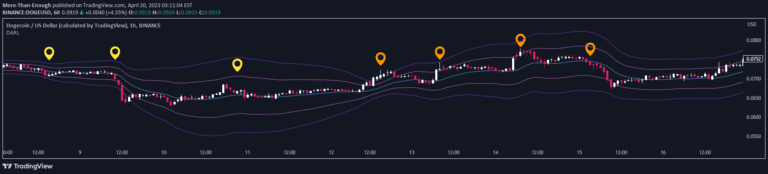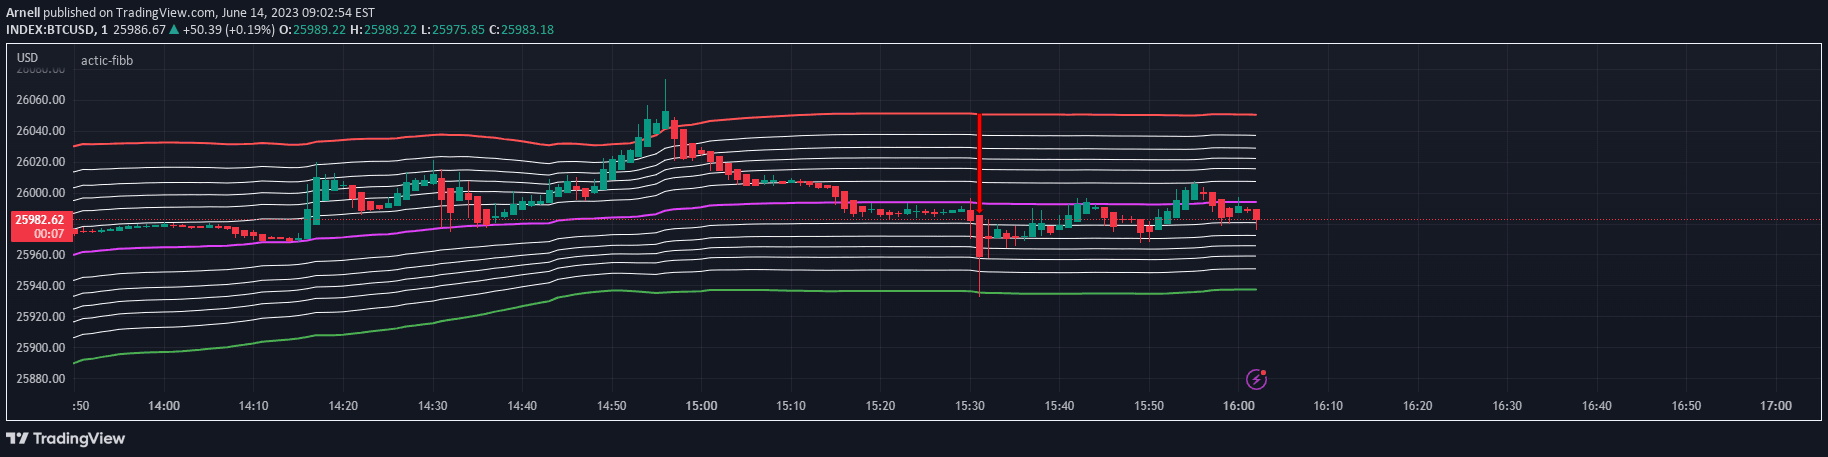
A trading signal utilizing Fibonacci and Bollinger Bands with 200-day VMA crossover, generating buy and sell arrows based on trend and volatility indicators.
Explore complementary indicator rolesHow it works
The signal integrates Fibonacci retracement levels with Bollinger Bands to identify potential market entry and exit points. It uses a 200-day Volume Moving Average (VMA) as a core trend identification mechanism, generating trading arrows when price crosses above or below this key level.
When the price crosses over or under the 200-day VMA, the indicator generates directional trading signals. These signals are further refined by analyzing the interaction with Fibonacci levels and Bollinger Bands, which help confirm the strength and potential sustainability of the identified trend.
Why it may be useful
This trading signal provides traders with a multi-layered approach to market analysis, combining trend, volatility, and momentum indicators into a single comprehensive tool. By integrating Fibonacci levels, Bollinger Bands, and VMA, traders can gain deeper insights into potential market movements and reduce the likelihood of false signals.
The signal's strength lies in its ability to filter out market noise and provide clear, actionable trading recommendations. It helps traders identify high-probability trade setups by considering multiple technical analysis perspectives simultaneously, thus enhancing decision-making and risk management strategies.
When to explore it
The signal is most effective in markets with clear trending characteristics, where price movements are more predictable and directional. It performs exceptionally well in liquid markets with sufficient trading volume, such as major stock indices, forex currency pairs, and large-cap stocks.
Traders should be cautious during periods of high market volatility or choppy, range-bound conditions where trend signals might generate more false positives. The indicator is best utilized in conjunction with other technical and fundamental analysis tools to confirm potential trade opportunities and manage risk effectively.
Keep exploring
What we’ve verified
Access, alerts and repainting behaviour have not been independently verified for this indicator. Check the creator’s current publication and settings.
General descriptions and classifications are recovered research. Verified details above identify the specific checks we have completed. Check the creator’s current publication for later changes.