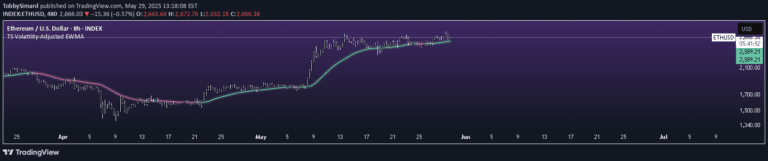
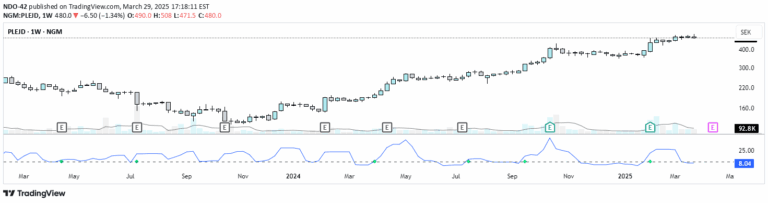
A volatility indicator that calculates average price range and adjusts sensitivity based on the asset's price level, providing insights into market fluctuations.
Explore complementary indicator rolesHow it works
The indicator starts by measuring price volatility through the difference between high and low prices over the past 20 bars. It calculates an average volatility metric by tracking these price ranges across recent trading periods. The core mechanism involves dynamically adjusting this volatility calculation based on the previous closing price.
When the asset's price falls below $20, the volatility measurement is multiplied by 2, increasing its sensitivity. Conversely, when the price exceeds $20, the volatility is multiplied by 1.5, providing a nuanced scaling approach. This adaptive method allows traders to understand how market fluctuations change relative to different price levels.
Why it may be useful
Volatility indicators are crucial for understanding market dynamics and potential price movements. By measuring price range fluctuations, traders can gain insights into market uncertainty and potential trading opportunities. This specific approach offers a dynamic view of market volatility that adapts to different price environments.
The indicator helps traders assess potential risk and market sentiment by providing a flexible measurement of price fluctuations. Its adaptive scaling mechanism allows for more refined analysis of market conditions, enabling traders to make more informed decisions about entry and exit points.
When to explore it
This volatility indicator is most effective in markets with significant price movements and changing market conditions. It works particularly well for assets that experience notable price level transitions and require adaptive volatility assessment. Traders can utilize this tool to identify potential breakout opportunities and market uncertainty.
The indicator is especially useful during periods of market transition, such as when an asset is moving between different price ranges. It can help traders gauge potential market volatility and adjust their strategies accordingly, providing valuable insights into market dynamics and potential trading signals.
Keep exploring
What we’ve verified
Access, alerts and repainting behaviour have not been independently verified for this indicator. Check the creator’s current publication and settings.
General descriptions and classifications are recovered research. Verified details above identify the specific checks we have completed. Check the creator’s current publication for later changes.