
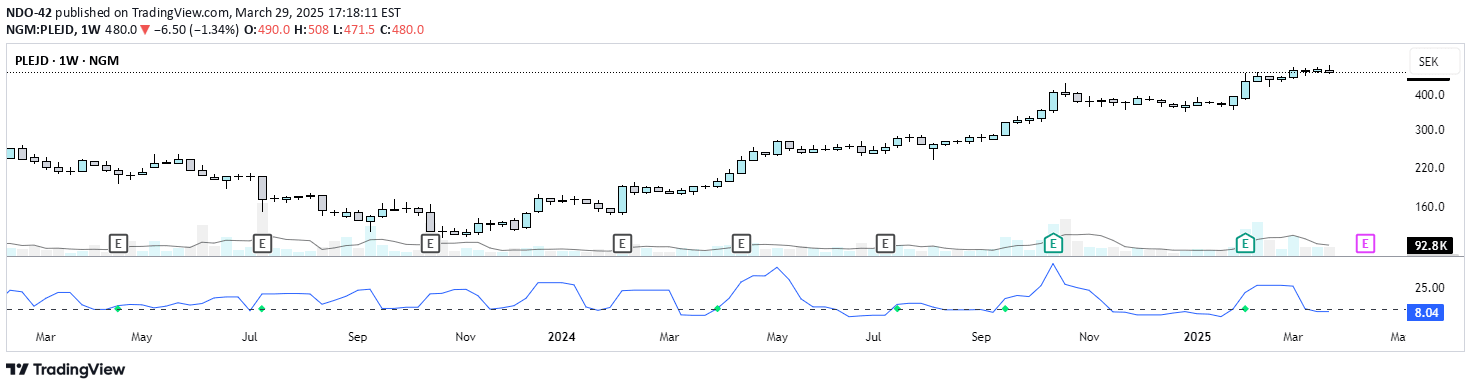
A volatility indicator measuring price range percentage over a specified period, helping traders identify periods of low volatility and potential market action.
Explore complementary indicator rolesHow it works
The indicator calculates price range by comparing the highest and lowest values of candle bodies over a defined period, typically 5 bars. It converts this range into a percentage, creating a visual representation of price movement volatility. The resulting line tracks how price ranges expand and contract over time.
By default, the indicator includes a dashed threshold line (usually at 10%) to help traders quickly identify when price movement is becoming tighter or more constrained. This allows for easy visual interpretation of volatility changes, with lower percentage values indicating less price movement and potential consolidation periods.
Why it may be useful
Understanding price volatility is crucial for traders seeking to manage risk and identify potential trading opportunities. This indicator provides a straightforward method to gauge market dynamics, helping traders recognize when price action is becoming more or less volatile. By visualizing range percentages, traders can anticipate potential breakouts or periods of market indecision.
The simplicity of the indicator makes it accessible to traders of all experience levels, offering a quick snapshot of market conditions. Its ability to highlight low volatility periods can be particularly valuable for setting alerts and preparing for potential significant market movements.
When to explore it
This volatility indicator is most effective during periods of market uncertainty or when traders want to assess potential trend changes. It works particularly well in markets that experience regular cycles of contraction and expansion, such as stocks, forex, and certain commodities.
Traders can use it to identify potential breakout moments when volatility is unusually low. The indicator is especially useful for day traders and scalpers who rely on understanding short-term price movements. By monitoring the percentage range, traders can set more informed entry and exit points, and prepare for potential trend reversals or significant price movements.
Keep exploring
What we’ve verified
Access, alerts and repainting behaviour have not been independently verified for this indicator. Check the creator’s current publication and settings.
General descriptions and classifications are recovered research. Verified details above identify the specific checks we have completed. Check the creator’s current publication for later changes.


