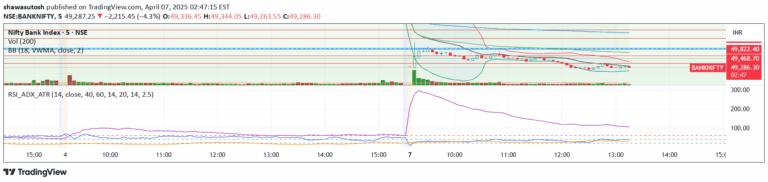
A three-line moving average indicator that visualizes market volatility across different timeframes, helping traders understand price action and market dynamics.
Explore complementary indicator rolesHow it works
The indicator uses three moving averages with different periods (5, 50, and 1000) to track volatility and price action. Each line represents a different timeframe, with the pink line showing very recent volatility, the blue line capturing more recent market movements, and the yellow line representing larger-scale market trends.
By analyzing the positioning and interaction of these moving averages, traders can gain insights into market volatility and potential trend changes. The proximity and oscillation of these lines provide visual cues about the current market conditions and potential future price movements.
Why it may be useful
Understanding market volatility is crucial for making informed trading decisions and managing risk effectively. This indicator helps traders quickly assess the current market state by providing a visual representation of price fluctuations across multiple timeframes.
By observing the relationships between these moving averages, traders can identify potential trend shifts, assess market momentum, and make more strategic entry and exit decisions. The multi-timeframe approach offers a comprehensive view of market dynamics that can enhance trading strategies.
When to explore it
This indicator is most effective during periods of significant market movement and when traders want to assess volatility across different time horizons. It works well in trending markets where clear directional movement can be observed through the interaction of the moving averages.
Traders should pay special attention when the pink line shows sharp increases or oscillates significantly, as this can indicate changing market conditions. The indicator is particularly useful for identifying potential trend reversals, assessing market volatility, and making more informed trading decisions across various timeframes.
Keep exploring
What we’ve verified
Access, alerts and repainting behaviour have not been independently verified for this indicator. Check the creator’s current publication and settings.
General descriptions and classifications are recovered research. Verified details above identify the specific checks we have completed. Check the creator’s current publication for later changes.