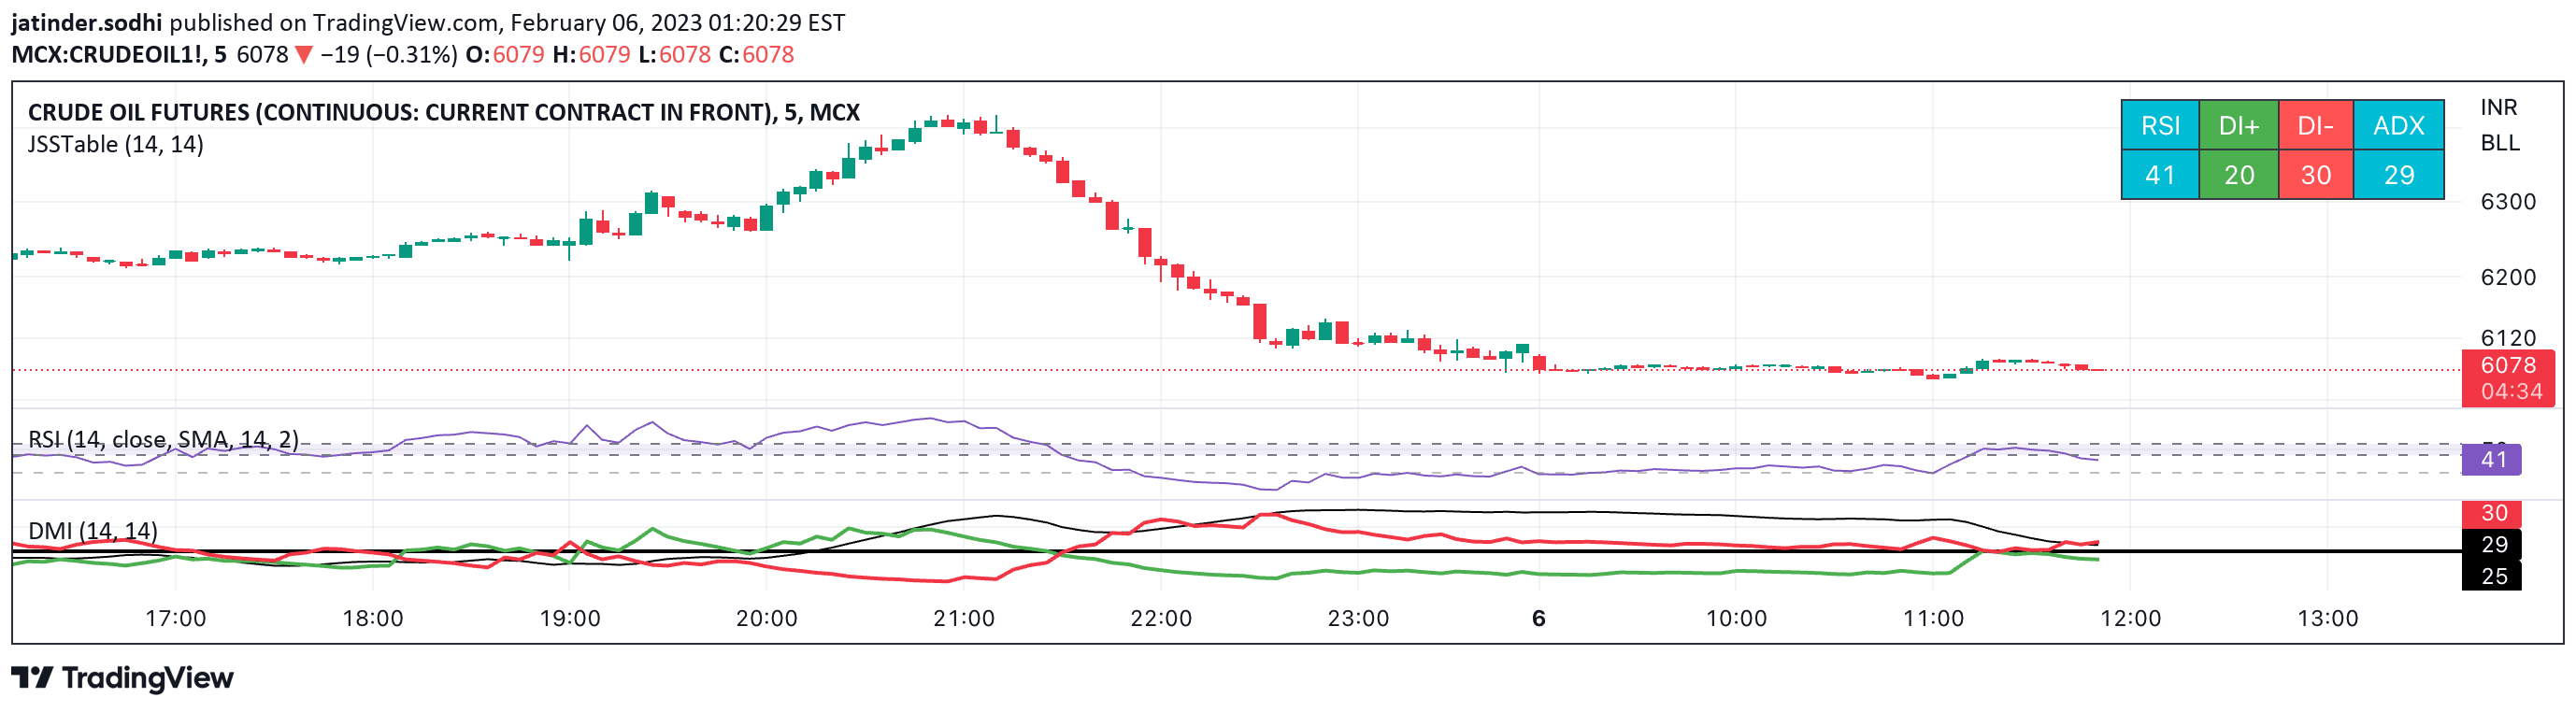
An improved ADX indicator that simplifies trend direction visualization with enhanced readability and additional features like average top/bottom calculations and experimental divergence detection.
Explore complementary indicator rolesHow it works
The improved ADX indicator simplifies the traditional Average Directional Index by making trend direction more visually clear and easier to interpret. It breaks down the complex intersecting lines of the standard ADX into a more streamlined representation, allowing traders to quickly understand market momentum and trend strength.
The indicator includes additional features beyond basic trend analysis, such as calculating average top and bottom levels and implementing experimental divergence detection. These enhancements provide traders with more nuanced insights into potential trend changes and market dynamics, going beyond the conventional ADX visualization methods.
Why it may be useful
This enhanced ADX indicator provides traders with a more intuitive and accessible way to analyze market trends and momentum. By simplifying the visual representation of directional movement, it reduces the complexity typically associated with traditional ADX indicators, making trend analysis more straightforward for traders of all skill levels.
The added features like average top/bottom calculations and divergence detection offer additional layers of market insight. These supplementary tools can help traders make more informed decisions by providing extra context and potential early warning signals about possible trend reversals or shifts in market momentum.
When to explore it
The improved ADX indicator is most effective in markets with clear trending conditions, where understanding directional movement is crucial for trading decisions. It works particularly well in volatile markets where rapid trend identification can provide a significant advantage, helping traders quickly assess the strength and potential sustainability of a current price trend.
Traders should use this indicator across multiple timeframes, from short-term scalping to longer-term swing trading strategies. While the divergence feature is experimental and should not be relied upon exclusively, it can serve as an additional tool for confirming potential trend changes and supporting other technical analysis methods.
Keep exploring
What we’ve verified
Access, alerts and repainting behaviour have not been independently verified for this indicator. Check the creator’s current publication and settings.
General descriptions and classifications are recovered research. Verified details above identify the specific checks we have completed. Check the creator’s current publication for later changes.