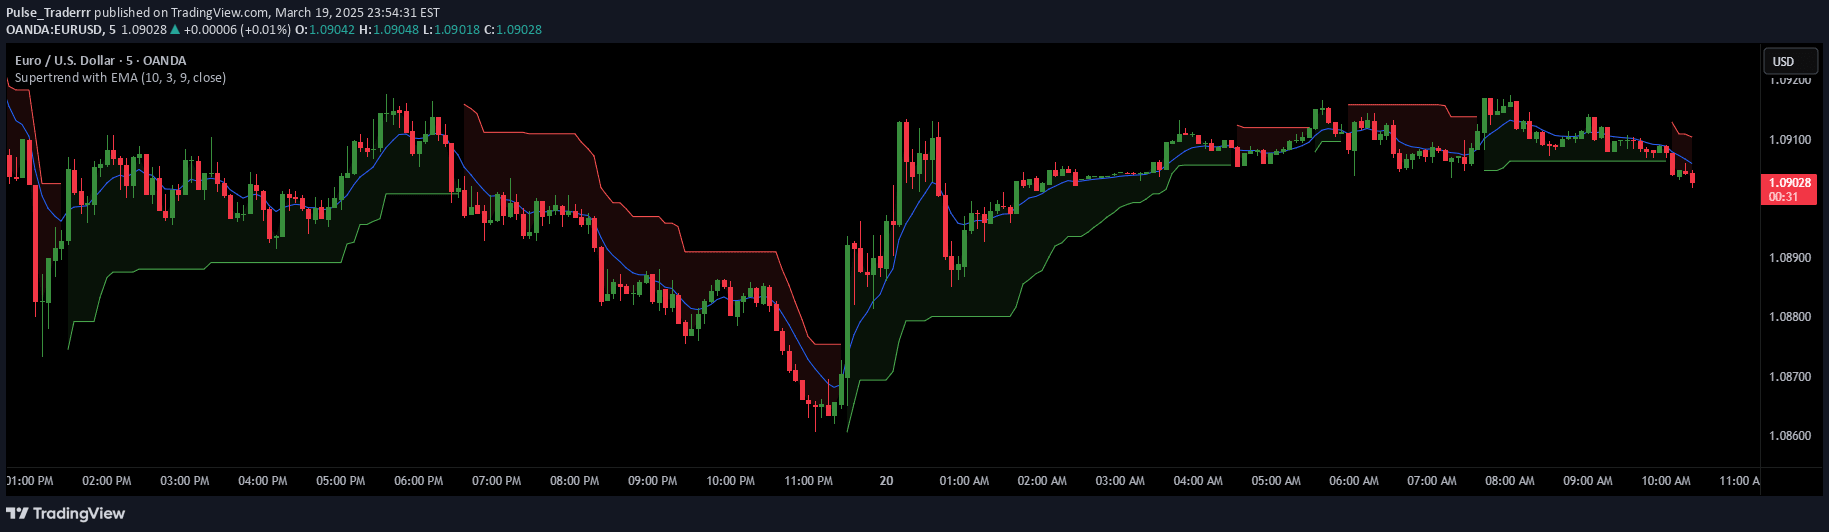
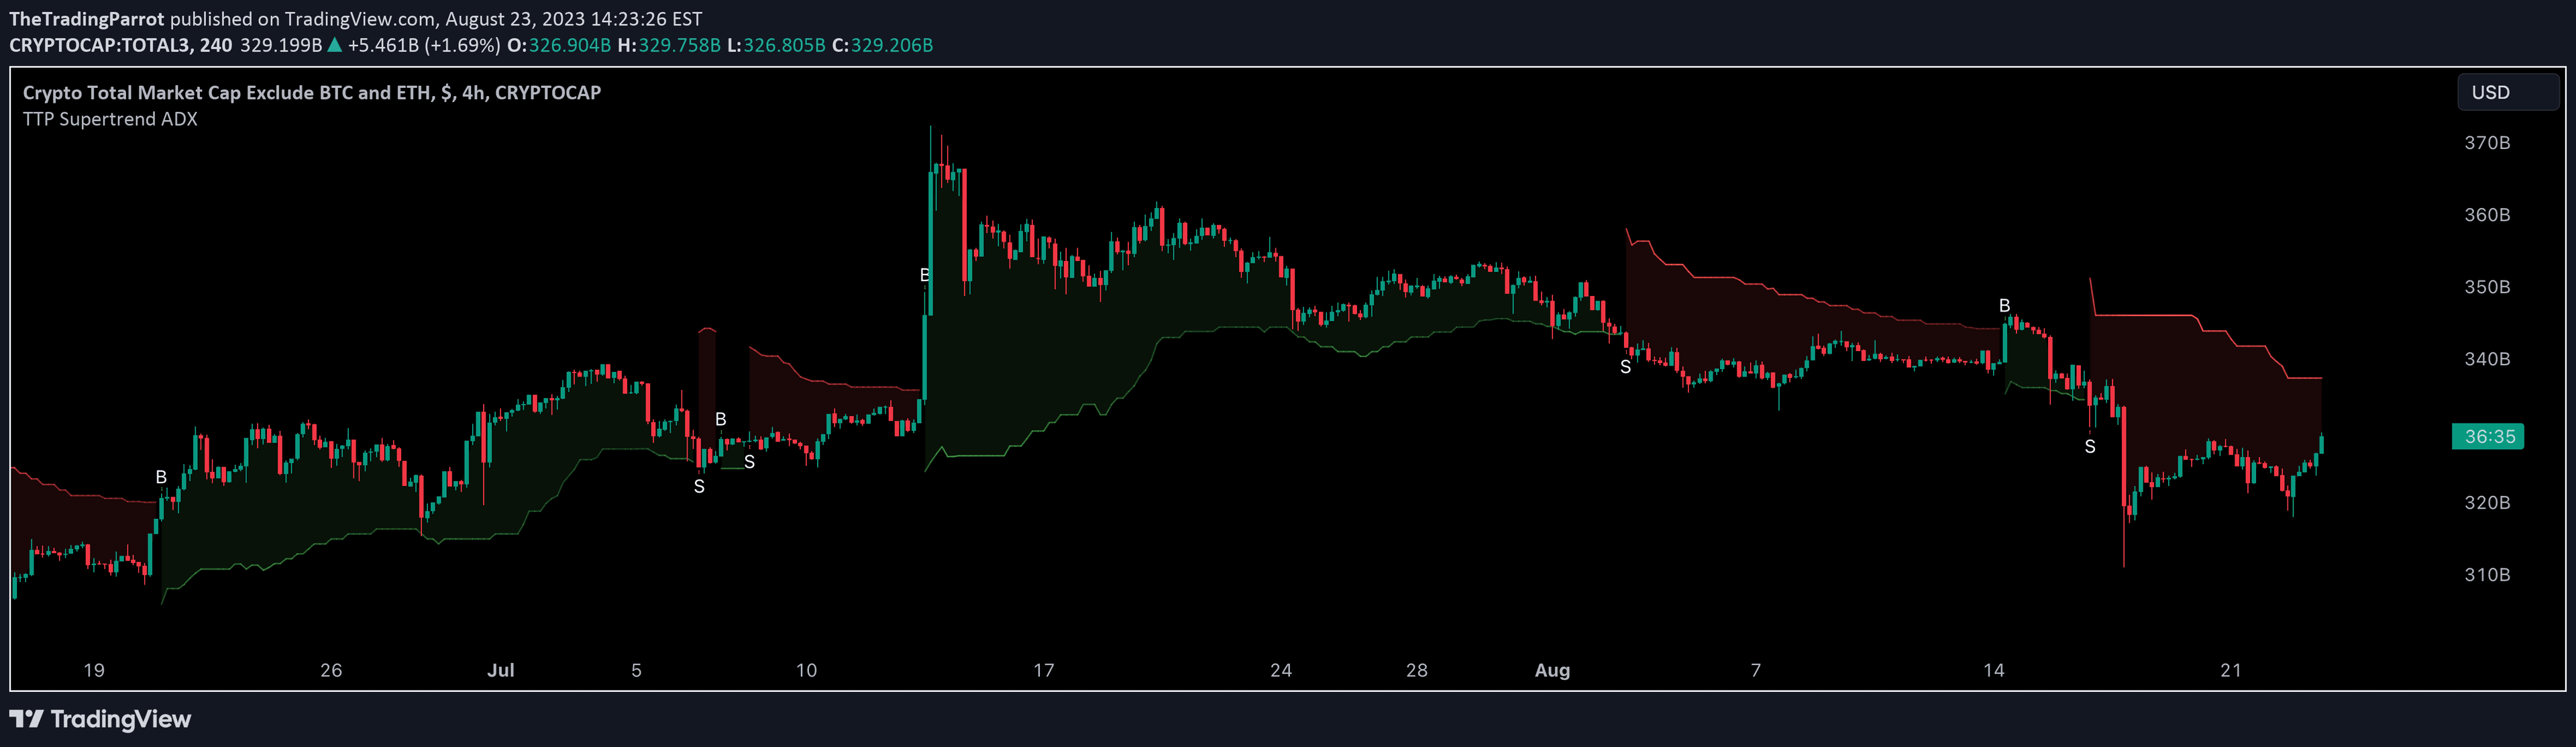
A comprehensive trading strategy combining Supertrend and 200 EMA to identify trend reversals and potential entry/exit points across different market conditions.
Explore complementary indicator rolesHow it works
The strategy integrates two powerful technical indicators: the Supertrend and the 200 EMA. The Supertrend uses Average True Range to determine market volatility and identify trend direction through color changes from red (bearish) to green (bullish). The 200 EMA serves as a long-term trend baseline, helping confirm the overall market sentiment.
When the Supertrend changes color and aligns with the price position relative to the 200 EMA, trading signals are generated. A buy signal occurs when the Supertrend turns green and price is above the 200 EMA, or when price crosses above the EMA with a green Supertrend. Conversely, sell signals emerge when the Supertrend turns red and price is below the 200 EMA.
Why it may be useful
This strategy provides traders with a nuanced approach to trend identification by combining volatility-based and moving average indicators. By using multiple confirmation signals, it reduces the likelihood of false entries and helps traders make more informed decisions about market direction and potential trend reversals.
The combination of Supertrend and 200 EMA offers a comprehensive view of market dynamics, helping traders understand both short-term volatility and long-term trends. This approach minimizes emotional trading by providing clear, objective entry and exit criteria based on technical analysis principles.
When to explore it
The Supertrend and 200 EMA strategy is most effective in trending markets with clear directional movement. It performs well in assets with moderate volatility, such as major currency pairs, blue-chip stocks, and popular commodities that exhibit consistent price patterns.
Traders should apply this strategy during periods of stable market conditions and avoid using it during extreme volatility or major economic announcements. It is particularly useful for traders seeking a systematic approach to trend trading that balances sensitivity to market changes with long-term trend confirmation.
Keep exploring
What we’ve verified
Access, alerts and repainting behaviour have not been independently verified for this indicator. Check the creator’s current publication and settings.
General descriptions and classifications are recovered research. Verified details above identify the specific checks we have completed. Check the creator’s current publication for later changes.