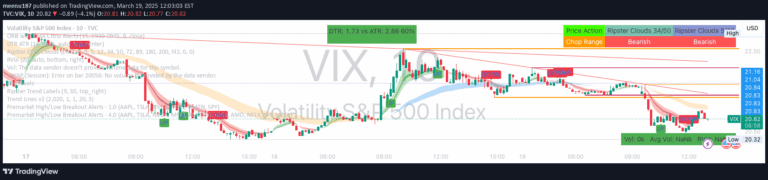
An indicator that identifies potential order block consolidation by detecting multiple bars with similar start and end points within a tight price range, signaling possible trend continuation or reversal.
Explore complementary indicator rolesHow it works
The indicator analyzes consecutive price bars to detect when three or more bars have ending points that closely match the starting points of previous bars within a 0.25% range. It systematically compares the price levels of recent bars, looking for tight clustering or repetitive price action that suggests potential consolidation or accumulation. This method tracks subtle price movements that might indicate underlying market sentiment and potential upcoming price action.
By establishing precise parameters for price similarity, the indicator creates a quantitative approach to identifying order blocks and potential breakout zones. The 0.25% range allows for minor price fluctuations while still maintaining a strict criterion for detecting meaningful price clustering, which can signal potential trend continuation or reversal points in the market.
Why it may be useful
This signal provides traders with a sophisticated method to detect potential consolidation zones where market participants might be preparing for a significant price movement. By identifying areas of tight price clustering, traders can gain insights into potential support or resistance levels that might not be immediately visible through traditional price analysis.
The indicator helps traders understand market psychology by revealing moments of price hesitation or accumulation. These zones often represent critical decision points where institutional traders or large market participants might be positioning themselves, making the signal valuable for understanding potential future price direction and momentum.
When to explore it
The indicator works best in markets with clear trending characteristics and during periods of potential trend continuation or reversal. It is particularly useful in liquid markets with sufficient trading volume, where price consolidation patterns are more likely to develop and provide meaningful signals.
Traders should apply this indicator in conjunction with other technical analysis tools to confirm potential trade setups. It is most effective when used on timeframes ranging from short-term (minutes) to medium-term (hours), making it especially suitable for scalping and day trading strategies where quick identification of potential price movements is crucial.
Keep exploring
What we’ve verified
Access, alerts and repainting behaviour have not been independently verified for this indicator. Check the creator’s current publication and settings.
General descriptions and classifications are recovered research. Verified details above identify the specific checks we have completed. Check the creator’s current publication for later changes.