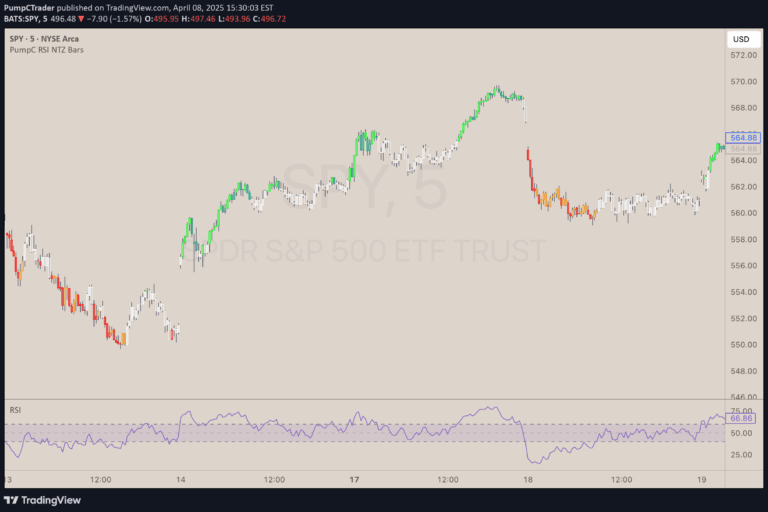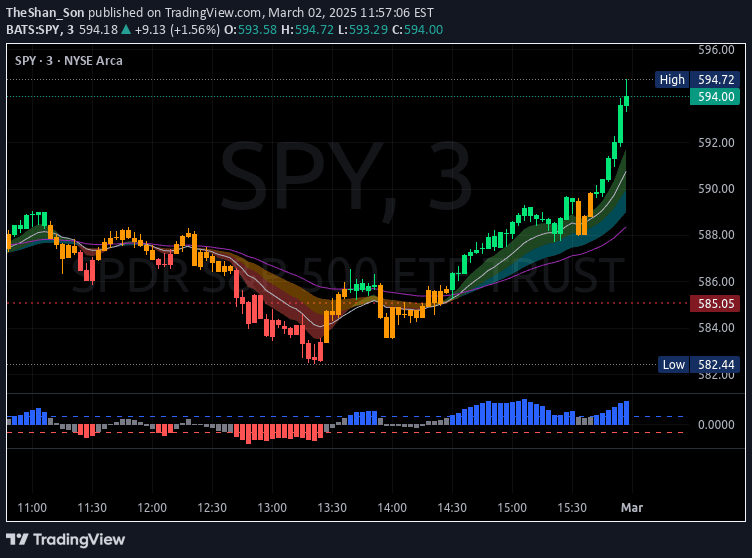
A dynamic RSI-based momentum indicator that adapts to market volatility, identifying trend shifts through color-coded candles and smoothed RSI bands.
Explore complementary indicator rolesHow it works
The signal begins by calculating a standard RSI over a specified period and then smoothing it using an Exponential Moving Average (EMA). This smoothed RSI becomes the core momentum measurement. The indicator then computes a Dynamic Average Range (DAR) by analyzing the volatility of the smoothed RSI's bar-to-bar movements using two EMAs.
The DAR is multiplied by a QQE multiplier to create adaptive upper and lower bands around the smoothed RSI. When the smoothed RSI crosses these bands, it signals a potential trend shift. The bands dynamically adjust based on market volatility, allowing the indicator to capture momentum changes more sensitively than traditional RSI approaches.
Why it may be useful
This signal provides traders with a more nuanced view of market momentum by adapting to changing market conditions. Unlike standard RSI, which can generate false signals in volatile markets, this approach uses dynamic bands that adjust to current market volatility, offering more reliable trend shift indications.
The color-coded candle system allows traders to quickly visualize momentum without constantly monitoring a separate oscillator. Green candles indicate strong bullish momentum, red candles show bearish momentum, and orange candles represent transitional or neutral market states, enabling faster and more intuitive trading decisions.
When to explore it
The indicator is most effective in markets with clear trending characteristics, where momentum shifts are significant and sustained. It works particularly well in liquid markets like major forex pairs, stock indices, and high-volume commodities where price movements are more predictable and less choppy.
Traders should use this signal in combination with other technical indicators to confirm signals, especially during periods of high market volatility or around major economic events. It's particularly useful for identifying potential trend reversals and measuring the strength of current market momentum across different timeframes.
Keep exploring
What we’ve verified
Access, alerts and repainting behaviour have not been independently verified for this indicator. Check the creator’s current publication and settings.
General descriptions and classifications are recovered research. Verified details above identify the specific checks we have completed. Check the creator’s current publication for later changes.