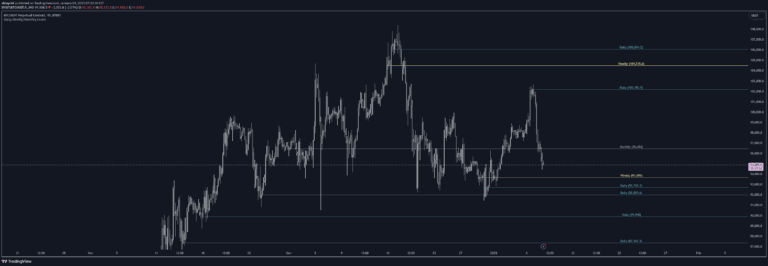
ATR Levels indicator measures market volatility and creates dynamic trigger and target levels for potential trading entry and exit points based on price fluctuations.
Explore complementary indicator rolesHow it works
The ATR Levels indicator calculates trigger and target levels using the Average True Range (ATR), which measures market volatility. It plots lines above and below the previous day's closing price based on a user-defined trigger percentage, creating upper and lower trigger levels for potential trading opportunities.
The indicator also generates two additional ATR target levels using multipliers, which help traders identify potential price targets. By dynamically adjusting these levels based on market volatility, the indicator provides a flexible framework for analyzing potential entry and exit points across different market conditions.
Why it may be useful
The ATR Levels indicator helps traders understand market volatility and make more informed trading decisions by providing visual reference points for potential price movements. By quantifying volatility and creating adaptive levels, traders can better assess risk and potential reward in their trading strategies.
These dynamic levels offer traders a systematic approach to identifying trade opportunities, reducing emotional decision-making and providing a structured method for analyzing market conditions. The customizable nature of the indicator allows traders to adapt it to different assets and trading styles.
When to explore it
The ATR Levels indicator works best in markets with clear directional movement and consistent volatility, such as stocks, forex, and futures markets. It is particularly useful during periods of moderate to high market volatility where price fluctuations provide clear trading opportunities.
Traders should use this indicator in conjunction with other technical analysis tools to confirm signals and validate potential trade setups. It is most effective for short-term trading strategies like scalping and day trading, where quick identification of volatility-based levels can provide a competitive advantage.
Keep exploring
What we’ve verified
Access, alerts and repainting behaviour have not been independently verified for this indicator. Check the creator’s current publication and settings.
General descriptions and classifications are recovered research. Verified details above identify the specific checks we have completed. Check the creator’s current publication for later changes.