
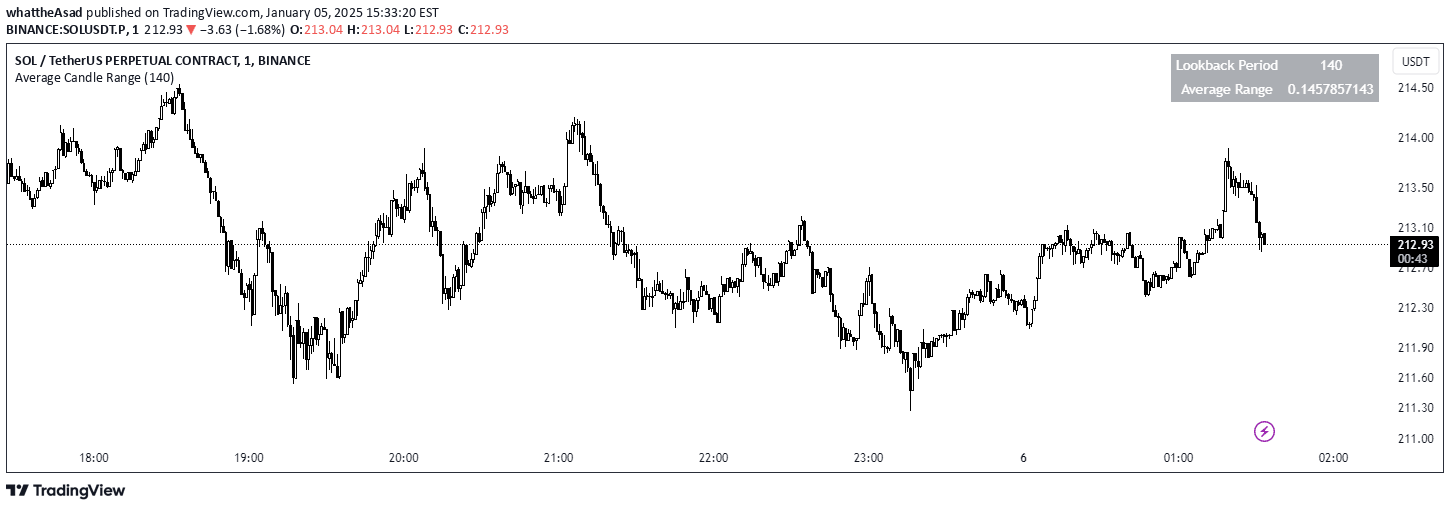
A specialized indicator that calculates the average trading range of candles over a specified period, helping traders analyze market volatility and identify potential trading opportunities.
Explore complementary indicator rolesHow it works
The indicator starts by calculating the range of each individual price candle by subtracting the low price from the high price. These individual candle ranges are then processed through a Simple Moving Average (SMA) calculation over a user-defined lookback period, typically set at 140 bars but adjustable from 1 to 500 bars.
As new price bars form, the indicator dynamically updates, computing the range for each new candle and recalculating the moving average. The result is displayed in a clean, top-right table overlay, showing the average trading range with high precision to 10 decimal places, allowing traders to quickly understand recent market volatility.
Why it may be useful
Understanding market volatility is crucial for effective trading, as it helps traders manage risk and adapt their strategies to current market conditions. By providing a clear, quantitative measure of price movement range, this indicator allows traders to make more informed decisions about position sizing, stop loss placement, and potential trade entry and exit points.
The high-precision calculation enables traders to detect subtle changes in market volatility that might not be immediately apparent through visual inspection. This granular insight can be particularly valuable in markets with small price movements, helping traders identify shifts in market dynamics before they become more pronounced.
When to explore it
This volatility indicator is most effective during periods of market transition, where understanding changing price dynamics can provide a competitive edge. Traders can use it to assess market conditions before entering trades, helping to determine whether current volatility levels align with their trading strategy and risk tolerance.
The indicator is particularly useful when trading across different market types, from highly liquid instruments with consistent movements to more erratic markets experiencing significant price fluctuations. By monitoring the average trading range, traders can adapt their approach, potentially scaling position sizes or adjusting stop-loss strategies in response to evolving market volatility.
Keep exploring
What we’ve verified
Access, alerts and repainting behaviour have not been independently verified for this indicator. Check the creator’s current publication and settings.
General descriptions and classifications are recovered research. Verified details above identify the specific checks we have completed. Check the creator’s current publication for later changes.


