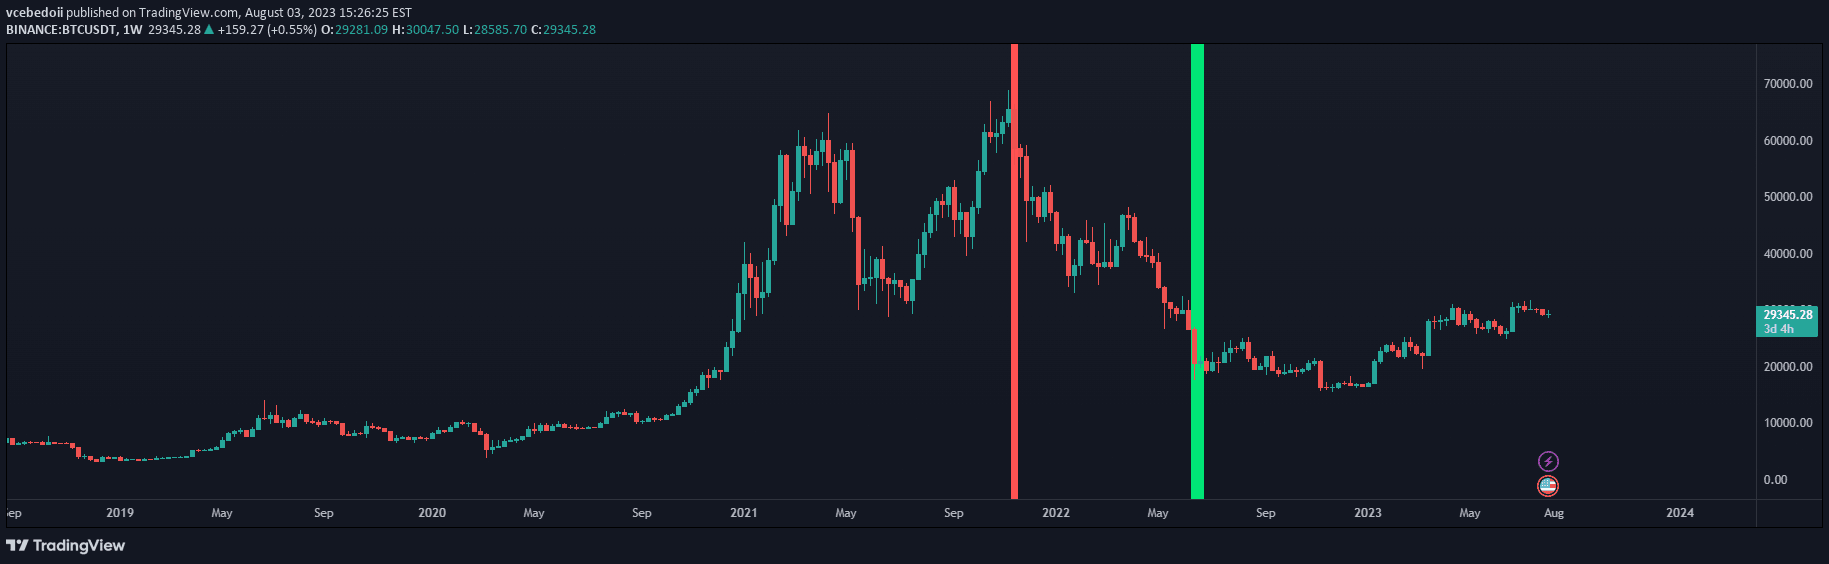
An advanced trend tracking indicator that uses multiple moving averages and deviation bands to identify price movements and potential trend changes across different chart views.
Explore complementary indicator rolesHow it works
The indicator creates an average trend line calculated from the last N bars' open, close, high, and low prices, providing a comprehensive view of price movement. It uses an Exponential Moving Average (EMA) to represent price action and a Signal Moving Average (SMA) to spot micro trends and potential entry/exit points.
The indicator offers two distinct visualization modes: a line view showing the average trend with deviation bands, and an oscillator view that displays price movement around a zero line. The deviation bands function similarly to Ichimoku Cloud bands, indicating the strength required for price to break through the average trend.
Why it may be useful
By combining multiple analytical techniques, this indicator provides traders with a nuanced understanding of market dynamics and potential trend reversals. The multiple display options allow traders to adapt their analysis to different trading styles and preferences, making it a versatile tool for market interpretation.
The use of deviation bands and multiple moving averages helps traders identify not just trend direction, but also trend strength and potential momentum shifts. This comprehensive approach reduces the likelihood of false signals and provides a more robust framework for making trading decisions.
When to explore it
This indicator is most effective in markets with clear trending characteristics, where price movements are relatively consistent and directional. It works well across various timeframes, making it suitable for scalpers, day traders, and swing traders seeking a comprehensive trend analysis tool.
Traders should pay particular attention to crossovers between the indicator line and signal line, as well as price interactions with the deviation bands. The oscillator view becomes especially useful in range-bound markets, helping traders identify potential entry and exit points based on momentum and trend strength.
Keep exploring
What we’ve verified
Access, alerts and repainting behaviour have not been independently verified for this indicator. Check the creator’s current publication and settings.
General descriptions and classifications are recovered research. Verified details above identify the specific checks we have completed. Check the creator’s current publication for later changes.