
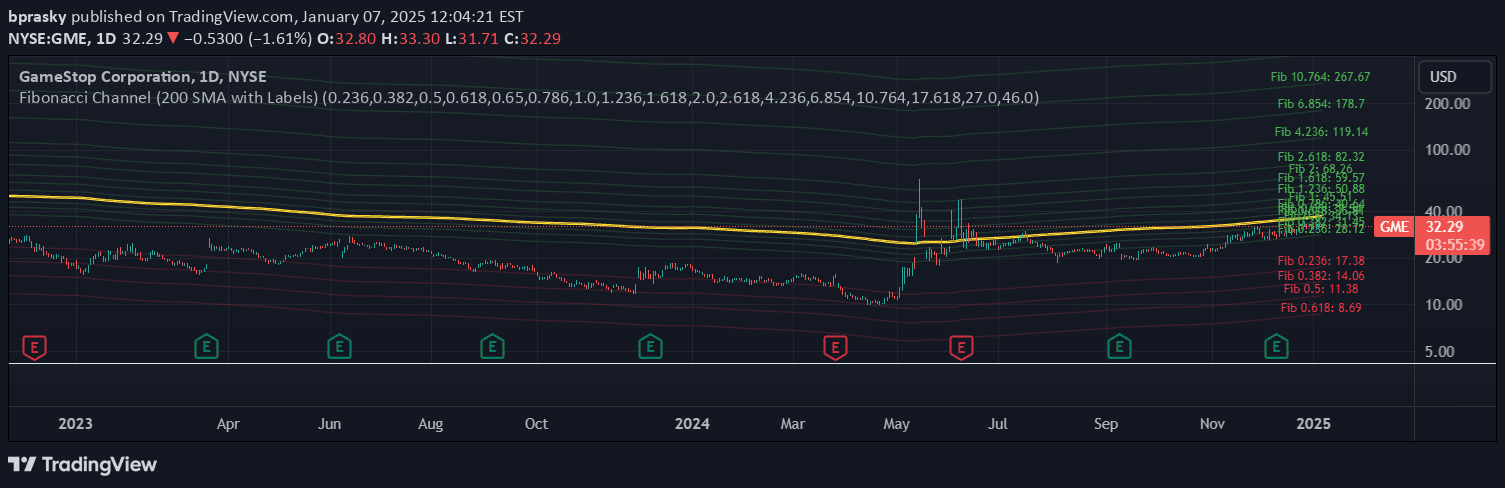
A dynamic trading strategy combining Fibonacci levels with the 200-period SMA to identify high-probability support and resistance zones across different market trends.
Explore complementary indicator rolesHow it works
The strategy dynamically calculates Fibonacci retracements and extensions relative to the 200-period simple moving average (SMA), creating adaptive support and resistance zones. It automatically adjusts these levels based on the current market trend, identifying key retracement points above or below the 200 SMA.
By tracking Fibonacci levels such as 38.2%, 50%, 61.8%, and extensions like 1.618, the tool provides traders with precise entry, exit, and risk management points. The 200 SMA serves as a foundational trend anchor, helping traders understand the underlying market direction and potential reversal or continuation zones.
Why it may be useful
This approach offers traders a more dynamic and context-aware method of identifying potential trade opportunities compared to static Fibonacci tools. By integrating the 200 SMA, traders can adapt their strategy to changing market conditions, ensuring more relevant and responsive trading decisions.
The method provides multiple layers of confirmation, including trend alignment, Fibonacci level interactions, and potential volume or price action signals. This multi-dimensional approach reduces false signals and helps traders make more informed decisions about market entry, exit, and risk management.
When to explore it
The strategy works best in markets with clear trending behavior, where price consistently respects Fibonacci levels and the 200 SMA. It is particularly effective during sustained uptrends or downtrends where price shows predictable retracement and extension patterns.
Traders should prioritize using this method in markets with sufficient liquidity and volatility, such as major forex pairs, stock indices, or actively traded commodities. Combining the Fibonacci-SMA strategy with additional confirmation indicators like volume analysis or complementary price action patterns can further enhance its reliability and precision.
Keep exploring
What we’ve verified
Access, alerts and repainting behaviour have not been independently verified for this indicator. Check the creator’s current publication and settings.
General descriptions and classifications are recovered research. Verified details above identify the specific checks we have completed. Check the creator’s current publication for later changes.




