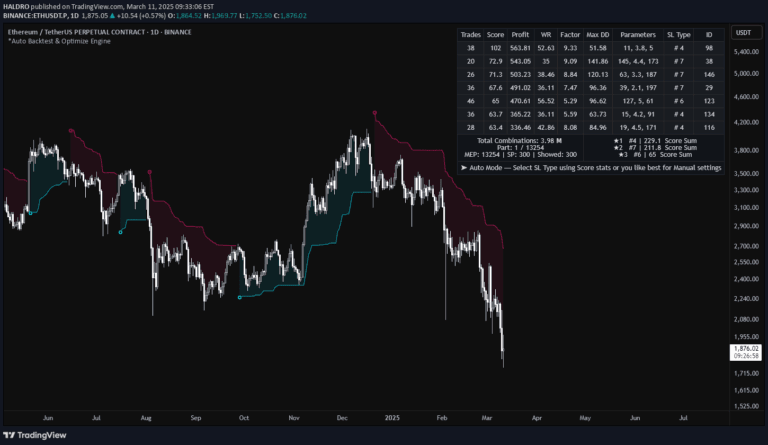
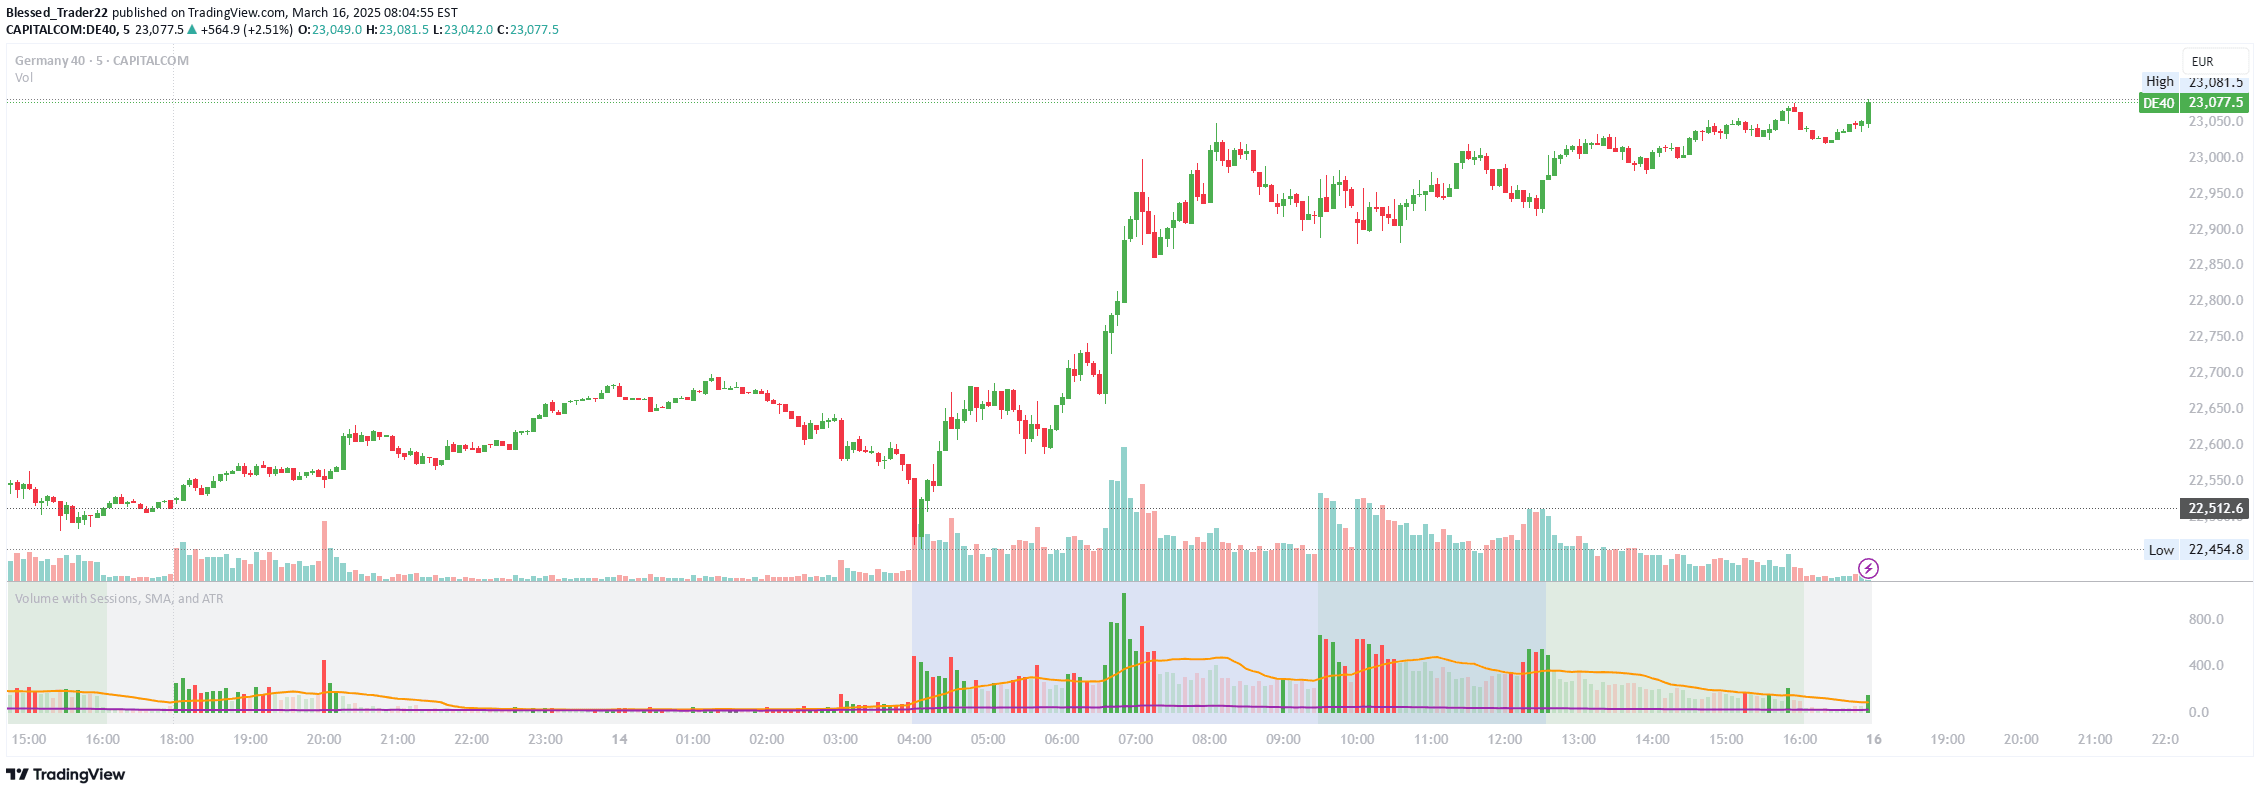
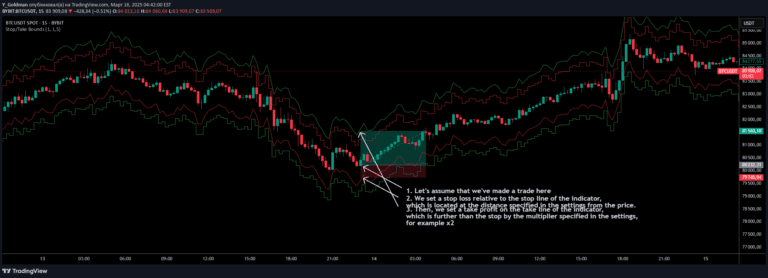
A backtest calculator that determines available intraday data length based on timeframe, allowing traders to analyze historical price data across different chart intervals.
Explore complementary indicator rolesHow it works
The backtest calculator operates by analyzing the length of available intraday data based on specific timeframe increments. For each minute interval, the system calculates the maximum historical data range, multiplying 6 weeks by the specific timeframe in minutes.
This approach allows traders to access progressively more historical data as the chart's timeframe increases. For instance, a 1-minute chart provides 6 weeks of data, while a 15-minute chart extends the historical analysis to 90 weeks, giving traders more comprehensive market insights.
Why it may be useful
The backtest calculator provides traders with a systematic method to understand historical market data availability across different timeframes. By offering clear guidelines on data accessibility, traders can make more informed decisions about their analysis and trading strategies.
This tool helps traders optimize their historical market research by demonstrating how chart intervals directly impact the depth of available data. Understanding these limitations allows traders to select the most appropriate timeframe for their specific analytical needs and trading objectives.
When to explore it
The backtest calculator is most useful when traders want to conduct comprehensive historical market analysis across various timeframes. It is particularly valuable for traders seeking to understand data limitations and maximize their research capabilities.
Traders should utilize this tool when planning detailed backtests, comparing different chart intervals, or determining the most suitable timeframe for their specific trading strategy. By understanding the relationship between timeframe and historical data availability, traders can make more strategic decisions about their market analysis approach.
Keep exploring
What we’ve verified
Access, alerts and repainting behaviour have not been independently verified for this indicator. Check the creator’s current publication and settings.
General descriptions and classifications are recovered research. Verified details above identify the specific checks we have completed. Check the creator’s current publication for later changes.