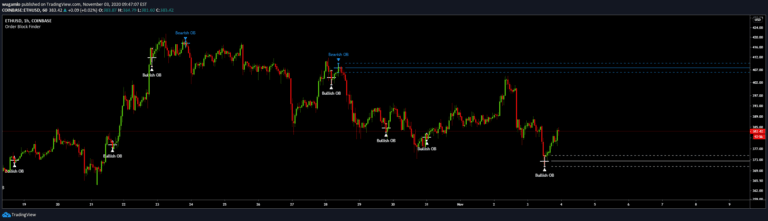
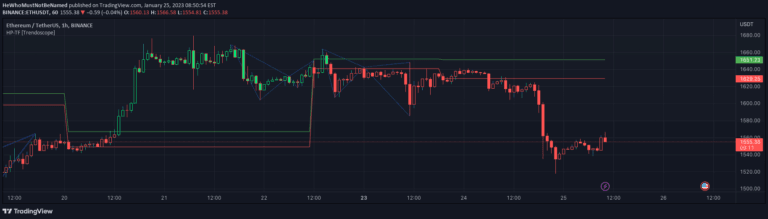
Market Structure Break & Order Block by EmreKb
A market structure break and order block indicator that identifies trend reversals by analyzing price action breakouts and key candle formations to signal potential trading opportunities.
Explore 11,183 indicators. Filter beyond the obvious.
Discover the tools that fit the way you trade.
11,183 tools to explore
A market structure break and order block indicator that identifies trend reversals by analyzing price action breakouts and key candle formations to signal potential trading opportunities.
An indicator identifying institutional order blocks by detecting significant price zones where potential trend reversals or continuations might occur based on sequential candle patterns.
An advanced algorithmic indicator that automatically identifies and classifies complex chart patterns by analyzing trend lines, pivot points, and geometric formations across multiple timeframes.
A specialized indicator that identifies and visualizes order blocks with volumetric information, helping traders understand market order concentrations and potential price reversal zones.
An advanced pattern recognition indicator that identifies ABC chart patterns using trend cloud, ZigZag, and Fibonacci levels to detect potential trading opportunities with customizable settings.
A technical analysis script that identifies cup-like price formations by creating channels and tracking potential breakout points in financial markets using specific bar search and channel width parameters.
A trend-following indicator that analyzes moving averages through a channel method, measuring trend strength by comparing channel widths and providing visual cues about market direction.
A trading script that projects future pivot points by analyzing historical price patterns and calculating potential next pivot locations using statistical analysis of market movements.
A customizable Pine Script indicator that generates a mini-chart displaying the last 10 candles with detailed visual settings, providing quick insights into recent price action and market behavior.
A statistical trailing stop tool that uses log-normal distribution of volatility to help traders lock in profits across different market conditions and trend strengths.
A trend-following trading signal that uses harmonic patterns to identify bullish and bearish zones by analyzing price movement across five confirmed pivot points.
Line Break Chart Strategy is a Japanese chart style focusing on price movements without time intervals. It creates dynamic trend visualization through up and down lines based on price breaks.
Likes, views, and comments are historical TradingView snapshots. They describe attention, not trading performance.