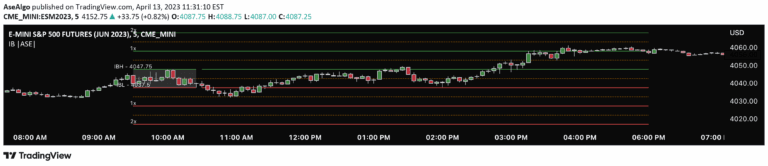
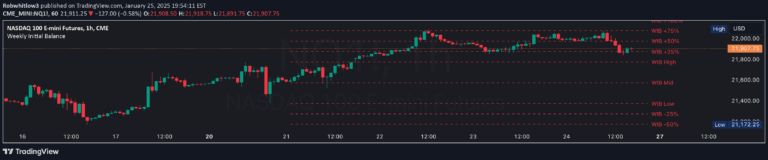
Balance zones identify market equilibrium by tracking price levels that are repeatedly respected, helping traders anticipate potential breakouts and create strategic price targets.
Explore complementary indicator rolesHow it works
Balance zones are created by identifying price ranges where markets demonstrate consistent equilibrium, tracking multiple touches of high and low levels. Traders analyze these zones by measuring the range and calculating potential extended targets, typically by doubling the original balance zone's size.
The script automatically plots lines based on balance high/low inputs, dividing the zone into multiple sections and generating potential reference levels. By mapping these zones, traders can visually understand market consolidation and potential breakout points.
Why it may be useful
Balance zones provide crucial insights into market psychology, revealing periods of price consolidation and potential future movement. They help traders understand market equilibrium and identify key decision points where significant price action might occur.
By offering a systematic approach to analyzing market balance, these zones enable traders to develop more strategic entry and exit points. They transform seemingly random price movements into structured, interpretable market information.
When to explore it
Balance zones are most effective during periods of market consolidation and when traders want to identify potential breakout opportunities. They work best in markets that demonstrate clear, repeatable price ranges across various timeframes and asset classes.
Traders should apply this technique when seeking to understand market sentiment, define potential support and resistance levels, and develop precise trading strategies. The method is particularly useful in markets showing consistent, predictable price behavior.
Keep exploring
What we’ve verified
Access, alerts and repainting behaviour have not been independently verified for this indicator. Check the creator’s current publication and settings.
General descriptions and classifications are recovered research. Verified details above identify the specific checks we have completed. Check the creator’s current publication for later changes.