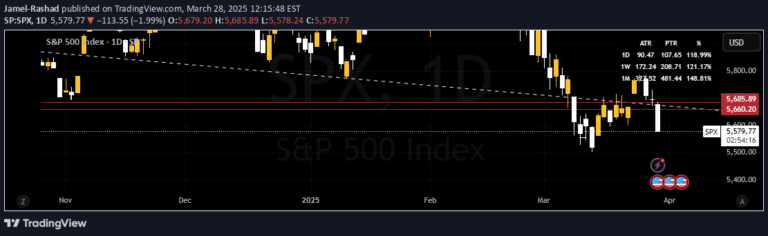
A trading strategy using India VIX to calculate potential high and low targets for BankNifty and Nifty by analyzing volatility across different timeframes.
Explore complementary indicator rolesHow it works
The strategy begins by obtaining the closing prices of India VIX, BankNifty, and Nifty. It then calculates the square root of different time periods including daily, weekly, monthly, and yearly intervals. The India VIX closing price is divided by these square root values to generate a decimal percentage.
This decimal percentage is then applied to the BankNifty's closing price to calculate potential high and low targets for the trading session. By using volatility measurements from the VIX index, traders can estimate potential price ranges and develop strategic entry and exit points based on market volatility.
Why it may be useful
Volatility-based strategies provide traders with a structured approach to understanding potential market movements by quantifying price fluctuations. By leveraging the VIX index, traders can gain insights into market sentiment and expected price ranges, which helps in making more informed trading decisions.
The method offers a systematic way to estimate potential market highs and lows, allowing traders to set realistic profit targets and manage risk more effectively. Understanding volatility can help traders adapt their strategies to changing market conditions and improve overall trading performance.
When to explore it
This strategy is most effective during periods of significant market volatility, where traditional technical indicators might provide less reliable signals. It works particularly well for traders interested in BankNifty and Nifty markets who want a quantitative approach to estimating potential price ranges.
Traders should consider using this method during earnings seasons, economic announcements, or other events that might cause increased market uncertainty. It is especially useful for day traders and swing traders who need to quickly assess potential price movements and adjust their trading strategies accordingly.
Keep exploring
What we’ve verified
Access, alerts and repainting behaviour have not been independently verified for this indicator. Check the creator’s current publication and settings.
General descriptions and classifications are recovered research. Verified details above identify the specific checks we have completed. Check the creator’s current publication for later changes.