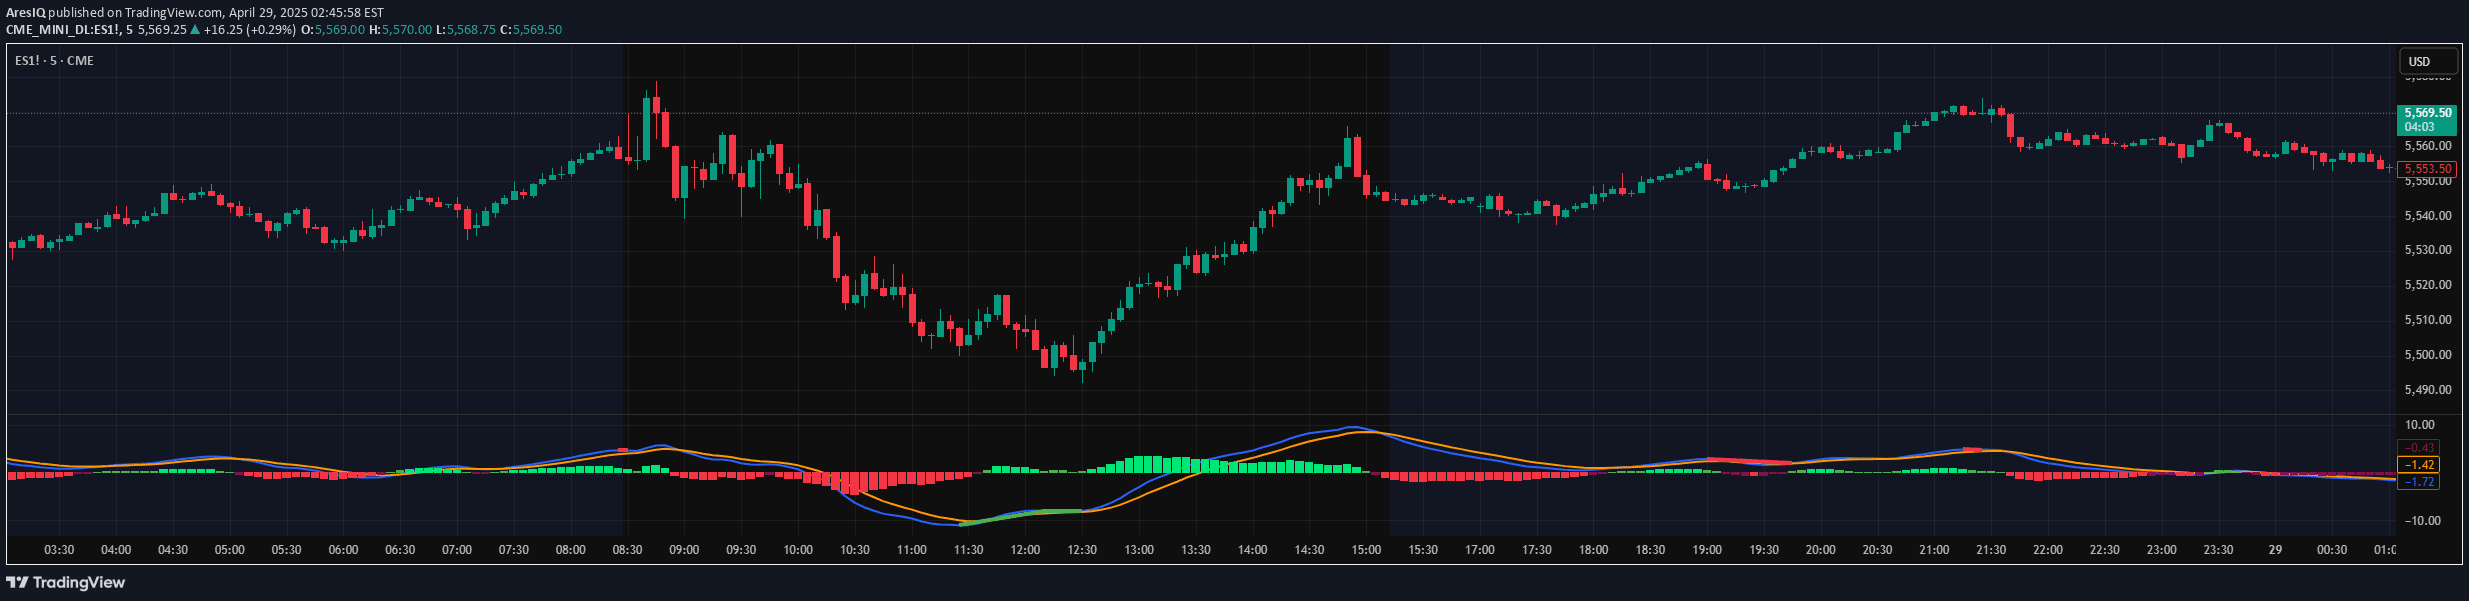
An advanced market analysis tool that uses dynamic Bollinger Bands and composite indicators to track price momentum, volatility, and potential trend reversals across different markets.
Explore complementary indicator rolesHow it works
The BAS Enhanced Indicator operates by dynamically calculating adaptive price bands and tracking price movements relative to these bands. It uses a unique width calculation (wd) to measure market volatility and combines multiple computational techniques including Exponential Moving Average (EMA) and Simple Moving Average (SMA).
The indicator generates signals through a composite calculation that integrates price position, band width, and customizable power functions. It plots multiple lines including a smoothed composite indicator, %D moving average, and mid-value references, providing traders with a comprehensive view of market momentum and potential trend shifts.
Why it may be useful
The BAS Enhanced Indicator provides traders with a sophisticated analytical tool that goes beyond traditional trend analysis by incorporating multiple layers of market information. Its adaptive design allows for precise identification of market conditions, helping traders make more informed decisions across different financial instruments.
By combining volatility measurement, trend strength assessment, and customizable signal lines, the indicator offers a comprehensive approach to market analysis. This multi-dimensional view reduces the likelihood of false signals and provides traders with increased confidence in their trading strategies.
When to explore it
The BAS Enhanced Indicator is most effective during periods of moderate to high market volatility where clear trend identification is crucial. It performs exceptionally well in markets with distinct price movements, such as stocks, forex, and cryptocurrency trading environments.
Traders should utilize this indicator when seeking to confirm trend reversals, identify potential breakout points, and gauge market momentum. It is particularly useful during transitional market phases where traditional indicators might provide less clear signals, offering a more nuanced approach to market analysis.
Keep exploring
What we’ve verified
Access, alerts and repainting behaviour have not been independently verified for this indicator. Check the creator’s current publication and settings.
General descriptions and classifications are recovered research. Verified details above identify the specific checks we have completed. Check the creator’s current publication for later changes.