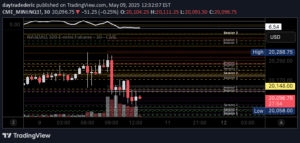
The Bat Harmonic Pattern uses Fibonacci ratios to identify potential market reversals by analyzing five key points and helping traders predict trend changes.
Explore complementary indicator rolesHow it works
The Bat Harmonic Pattern is a complex technical analysis tool that identifies potential market reversals using precise Fibonacci ratios between five interconnected points: X, A, B, C, and D. Traders meticulously measure the relationships between these points, with special emphasis on the 88.6% retracement level of the XA leg, which serves as a critical turning point for potential trend reversal.
By analyzing the geometric structure and Fibonacci measurements of each wave, traders can distinguish between bullish and bearish patterns. In a bullish scenario, the pattern suggests a potential uptrend after a downward movement, while in a bearish scenario, it indicates a possible downtrend following an upward price movement.
Why it may be useful
The Bat Harmonic Pattern provides traders with a sophisticated method for identifying high-probability reversal points in financial markets by leveraging mathematical precision and geometric relationships. It offers a structured approach to understanding market dynamics, enabling traders to make more informed decisions about potential entry and exit points with a quantitative framework.
By integrating Fibonacci ratios with pattern recognition, this tool helps traders anticipate market movements with greater accuracy and reduces emotional decision-making. The pattern's systematic approach allows for objective analysis, helping traders manage risk and potentially improve their trading strategy's overall performance.
When to explore it
The Bat Harmonic Pattern works best in markets with clear trending characteristics and sufficient price volatility, making it particularly effective in forex, stocks, and cryptocurrency markets. Traders should look for well-defined price movements that allow for precise Fibonacci ratio measurements, ensuring the pattern's geometric conditions are met accurately.
It is most reliable when used in conjunction with other technical analysis tools and confirmation signals, such as volume indicators or additional momentum oscillators. Traders should exercise caution and implement robust risk management strategies, using stop-loss orders and waiting for price confirmation before executing trades based on the pattern.
Keep exploring
What we’ve verified
Access, alerts and repainting behaviour have not been independently verified for this indicator. Check the creator’s current publication and settings.
General descriptions and classifications are recovered research. Verified details above identify the specific checks we have completed. Check the creator’s current publication for later changes.