
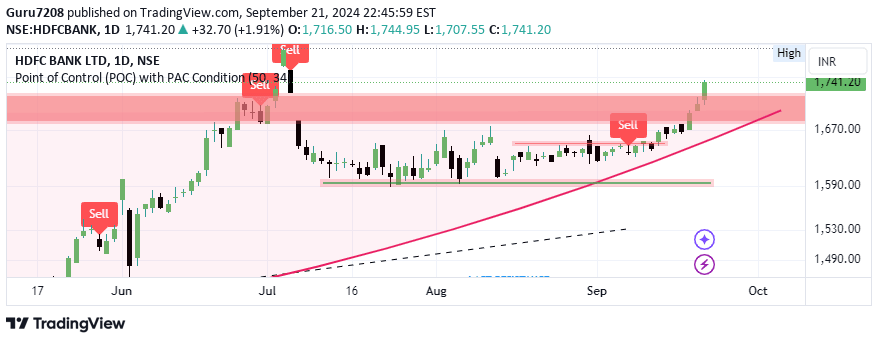
A technical trading signal that identifies potential sell opportunities by analyzing price, volume, and moving averages to confirm market trends and trading conditions.
Explore complementary indicator rolesHow it works
The signal uses multiple technical indicators to generate a comprehensive sell recommendation. It calculates the Point of Control (POC) over the last 50 days, which represents the price level with the highest trading volume, and plots this as a reference line on the chart.
Additionally, the signal incorporates a 3-day volume Simple Moving Average (SMA) and Price Action Channel (PAC) Exponential Moving Averages (EMAs) based on low and close prices to validate potential selling opportunities.
Why it may be useful
This signal provides traders with a multi-layered approach to identifying potential selling opportunities by combining volume analysis, price action, and moving averages. It helps traders make more informed decisions by requiring multiple confirmatory conditions before generating a sell signal.
By incorporating volume, price levels, and trend indicators, the signal reduces the likelihood of false or premature trading signals and offers a more comprehensive view of market conditions.
When to explore it
The signal is most effective in markets with clear directional movements and sufficient trading volume. It works best when there are identifiable trends and significant market activity that can support potential selling opportunities. Traders should use this signal in conjunction with other technical and fundamental analysis tools to validate trading decisions and manage risk effectively.
Keep exploring
What we’ve verified
Access, alerts and repainting behaviour have not been independently verified for this indicator. Check the creator’s current publication and settings.
General descriptions and classifications are recovered research. Verified details above identify the specific checks we have completed. Check the creator’s current publication for later changes.


