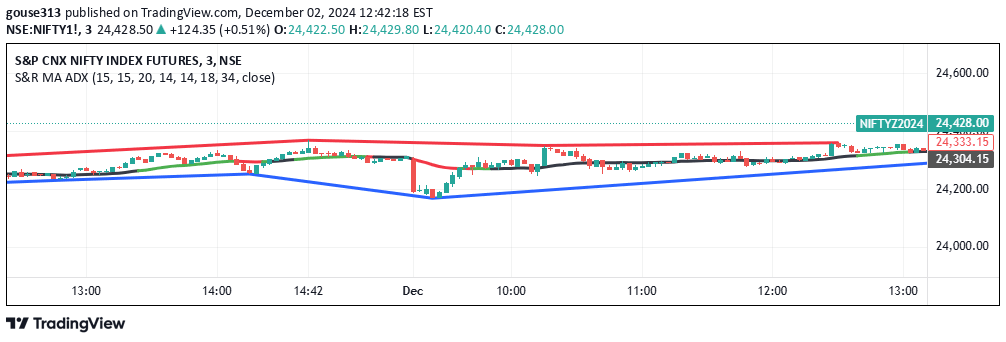
An advanced trading indicator combining EMA crossover signals with historical price projection, offering buy/sell triggers and future price forecasting based on trend analysis.
Explore complementary indicator rolesHow it works
The EMA Crossover with Historical Price Projection uses two exponential moving averages (EMA 9 and EMA 21) to generate trading signals. When the shorter EMA crosses above the longer EMA, it triggers a bullish signal, and when it crosses below, it generates a bearish signal. The indicator calculates these crossovers using precise mathematical comparisons between the two moving averages.
Additionally, the indicator projects future prices by analyzing historical price changes and applying a user-defined drift factor. It captures percentage changes between bars and uses these to create a potential price projection line, allowing traders to visualize potential future price movements with an optional uncertainty area.
Why it may be useful
This indicator provides traders with a comprehensive view of market trends and potential future price movements. By combining EMA crossover signals with price projection, it offers a more nuanced approach to market analysis than traditional single-method indicators. The visual representation helps traders understand both current trend dynamics and potential future price trajectories.
The projection mechanism allows traders to anticipate potential price movements based on historical trends, giving them a strategic advantage in decision-making. The ability to customize drift factors and forecast areas makes this indicator adaptable to different market conditions and trading styles.
When to explore it
The EMA Crossover with Historical Price Projection is most effective in markets with clear trend characteristics, such as forex, stocks, and cryptocurrencies. It works best in trending markets where price movements show consistent directional momentum. Traders should use this indicator during periods of relatively stable market conditions where historical patterns can provide meaningful insights.
The indicator is particularly useful for short to medium-term trading strategies, especially in markets with moderate volatility. Traders should combine this indicator with other technical analysis tools to confirm signals and reduce the risk of false predictions. It is most reliable when used alongside volume analysis and additional trend confirmation indicators.
Keep exploring
What we’ve verified
Access, alerts and repainting behaviour have not been independently verified for this indicator. Check the creator’s current publication and settings.
General descriptions and classifications are recovered research. Verified details above identify the specific checks we have completed. Check the creator’s current publication for later changes.