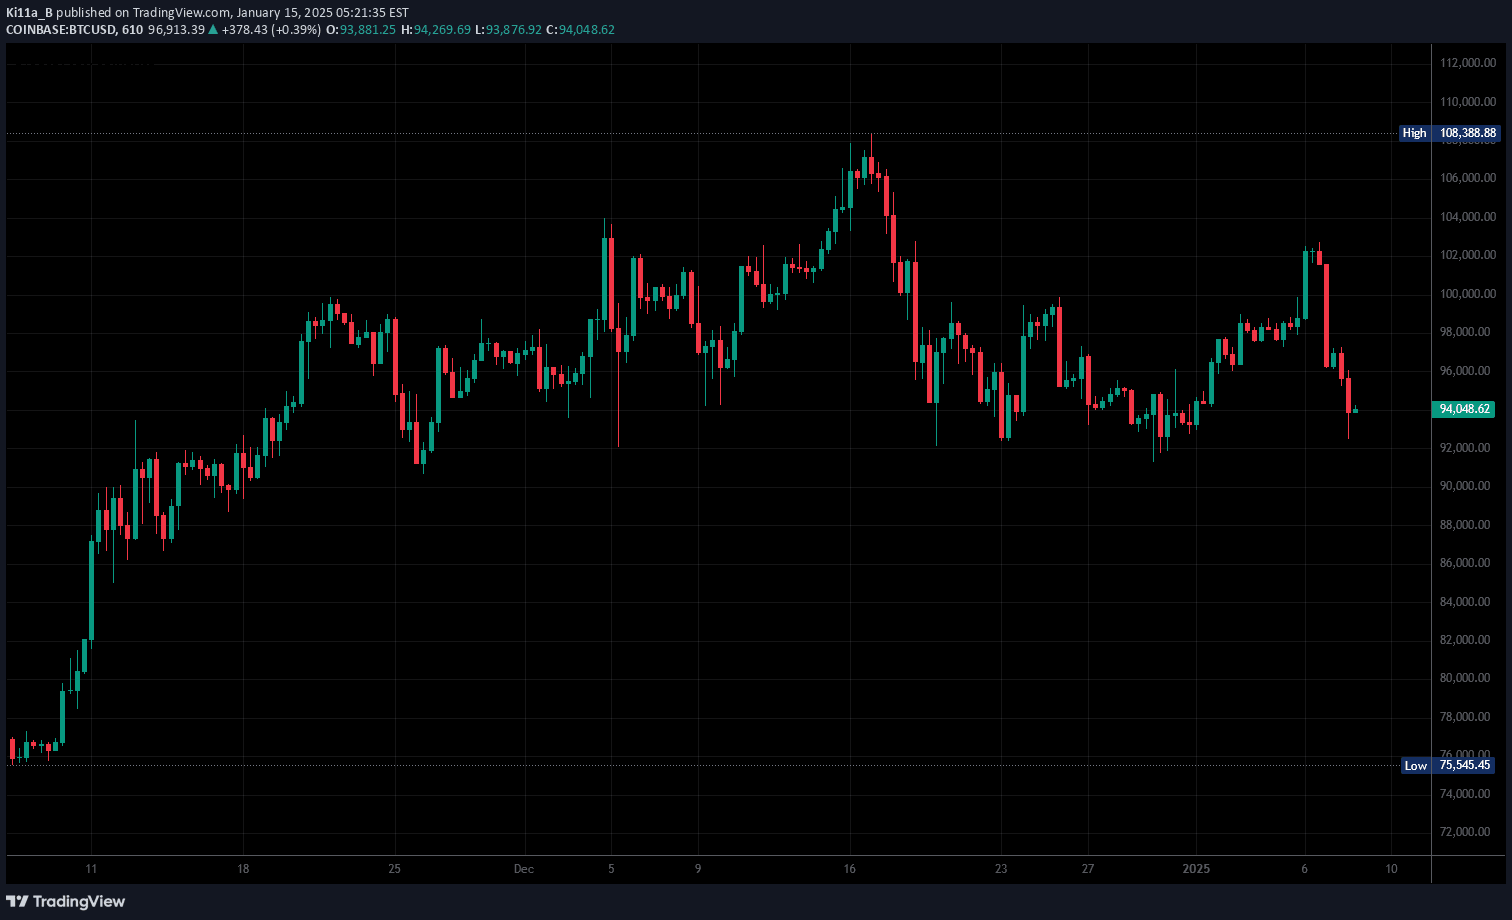
A custom Moving Average indicator that combines Daily, Weekly, and Monthly timeframes to help traders optimize positioning and maximize trade potential across different market perspectives.
Explore complementary indicator rolesHow it works
This Moving Average indicator works by integrating multiple timeframe Moving Averages to provide a comprehensive view of market trends. Traders can combine Daily MAs with Weekly or Monthly MAs, allowing for a more nuanced analysis of price movement and trend direction.
The indicator allows customization of settings, including label placement, line thickness, and timeframe selection. By strategically positioning the chart and configuring the indicator, traders can gain deeper insights into market dynamics and potential price movements across different time horizons.
Why it may be useful
Moving Averages are crucial tools for understanding market trends and identifying potential trading opportunities. They help smooth out price fluctuations, revealing underlying market direction and helping traders make more informed decisions about entry and exit points.
By combining multiple timeframe MAs, traders can develop a more comprehensive understanding of market trends, reducing the risk of making decisions based on limited perspective. This approach provides a more robust analytical framework for assessing market conditions and potential trading strategies.
When to explore it
This Moving Average indicator is most effective when traders want to analyze market trends across multiple timeframes. It is particularly useful for identifying trend strength, potential trend reversals, and confirming price movements in different market conditions.
Traders should use this indicator when they need a comprehensive view of market dynamics, want to validate trends across different time horizons, or seek to develop a more nuanced understanding of price movement. It is especially valuable for traders looking to make more informed decisions by considering broader market context.
Keep exploring
What we’ve verified
Access, alerts and repainting behaviour have not been independently verified for this indicator. Check the creator’s current publication and settings.
General descriptions and classifications are recovered research. Verified details above identify the specific checks we have completed. Check the creator’s current publication for later changes.