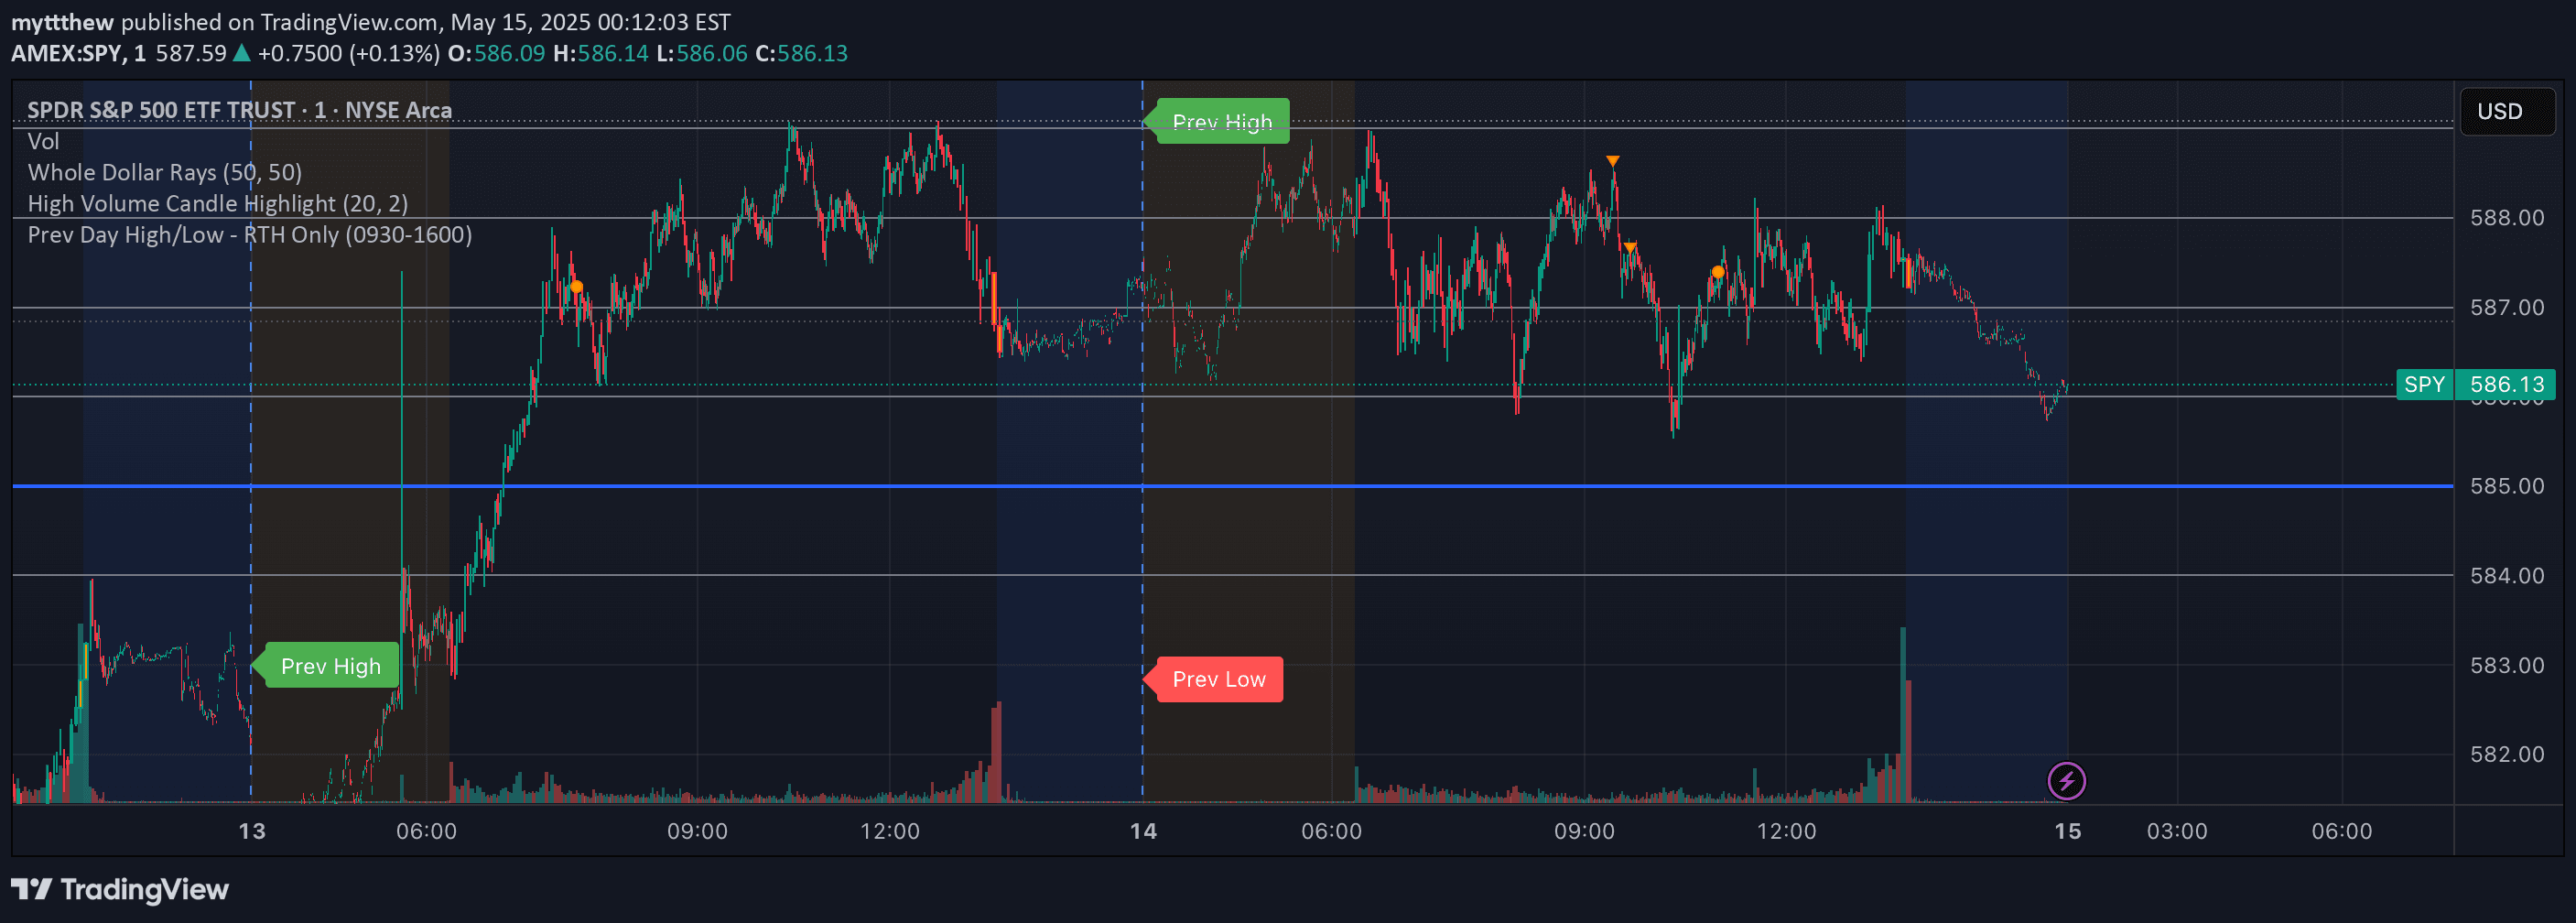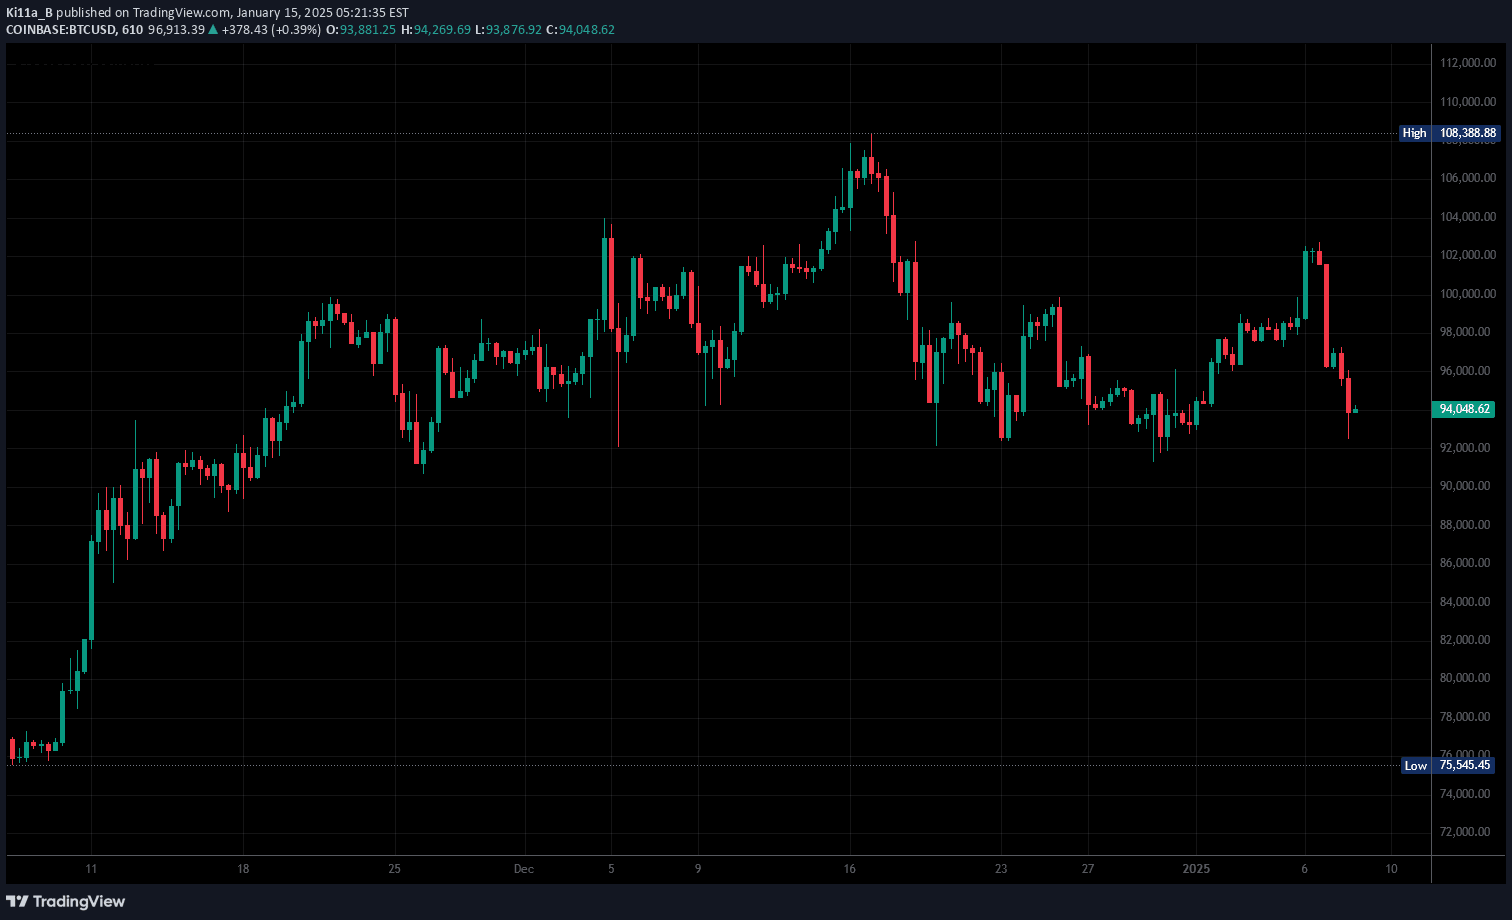
A Bollinger Bands indicator that applies horizontal lines to daily bands across all timeframes, helping traders optimize positioning and identify support and resistance levels.
Explore complementary indicator rolesHow it works
The Bollinger Bands indicator uses standard deviation to create dynamic price channels that expand and contract based on market volatility. It plots three lines: a central moving average with upper and lower bands that adapt to price fluctuations.
By applying horizontal lines to these daily bands, traders can quickly identify key support and resistance levels across different timeframes. The indicator allows for customizable settings, enabling traders to adjust the parameters to suit their specific trading style and market conditions.
Why it may be useful
Bollinger Bands provide crucial insights into market volatility and potential price movements by measuring the statistical spread of prices around a central average. They help traders identify overbought and oversold conditions, potential trend reversals, and periods of market consolidation.
The added horizontal line feature enhances the indicator's utility by providing clear visual reference points for entry, exit, and stop-loss strategies. This tool can help traders make more informed decisions by offering a comprehensive view of price dynamics and potential market turning points.
When to explore it
Bollinger Bands are most effective in markets with clear trending or ranging characteristics, where price volatility is relatively consistent. They work exceptionally well in forex, stocks, and futures markets, providing valuable insights across multiple asset classes and timeframes.
Traders should use this indicator during periods of market stability and when looking to identify potential breakout or reversal points. It is particularly useful when combined with other technical analysis tools to confirm signals and develop more robust trading strategies.
Keep exploring
What we’ve verified
Access, alerts and repainting behaviour have not been independently verified for this indicator. Check the creator’s current publication and settings.
General descriptions and classifications are recovered research. Verified details above identify the specific checks we have completed. Check the creator’s current publication for later changes.