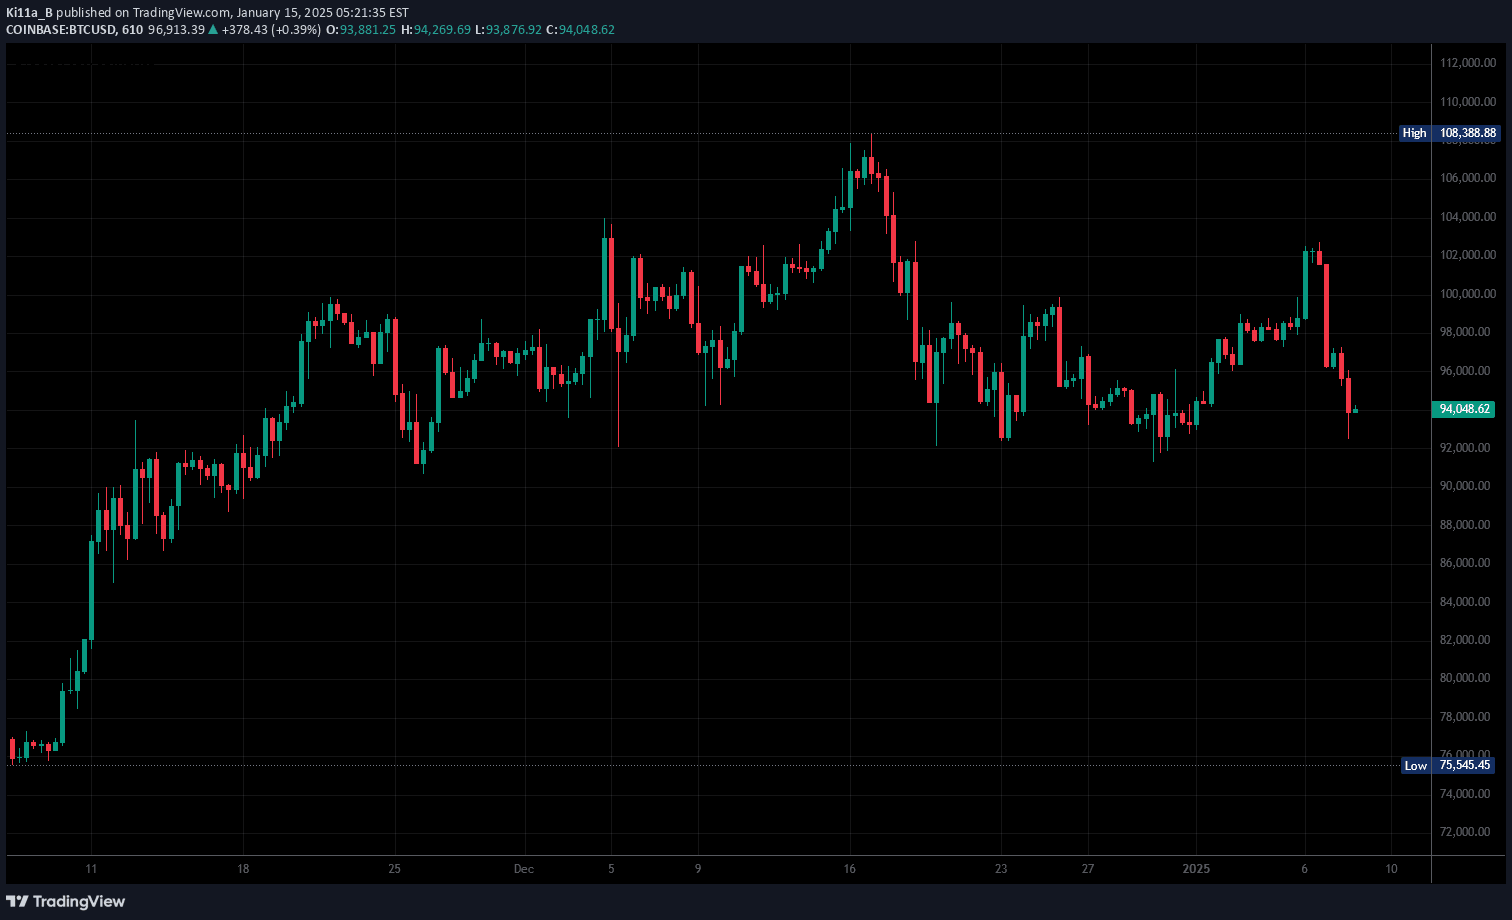
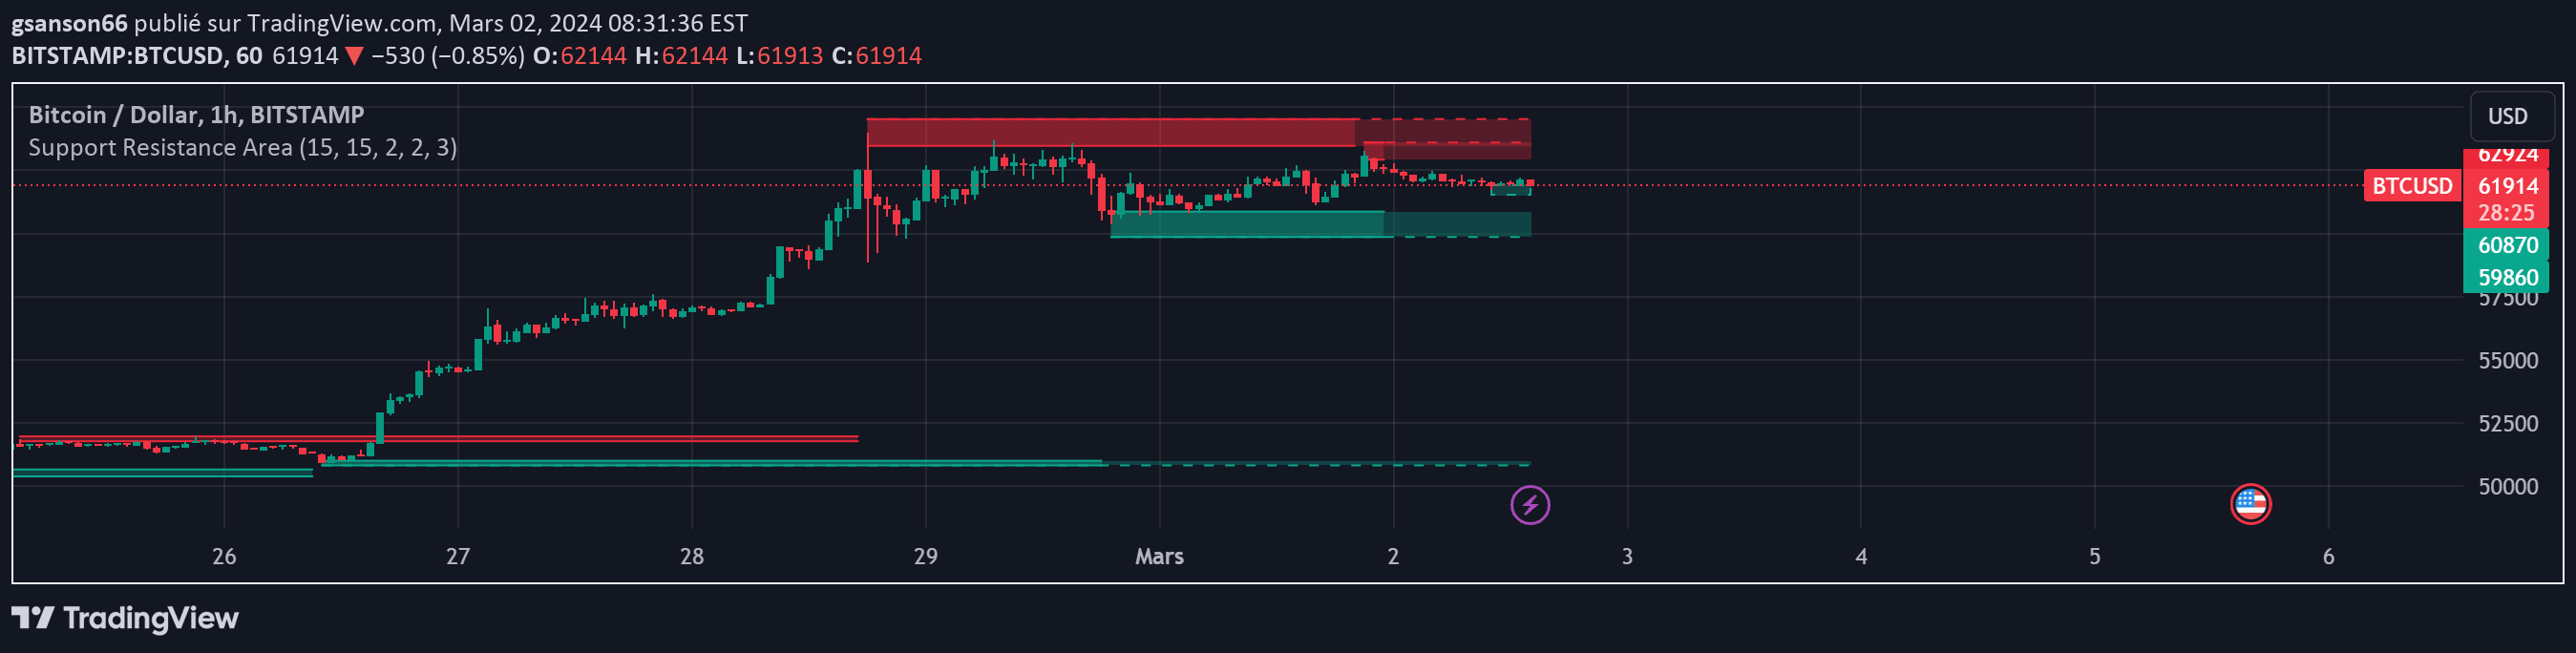
A multi-timeframe Bollinger Bands indicator that automatically draws support and resistance lines across different time frames to simplify chart analysis.
Explore complementary indicator rolesHow it works
The indicator leverages Bollinger Bands across multiple timeframes to identify dynamic support and resistance levels. By analyzing price movements and standard deviations, it generates adaptive bands that expand and contract with market volatility.
The multi-timeframe approach allows traders to view potential support and resistance zones simultaneously, providing a comprehensive view of price dynamics. Each timeframe's Bollinger Bands are calculated independently, offering nuanced insights into market behavior at different scales.
Why it may be useful
Manually identifying support and resistance levels can be time-consuming and subjective, making traders prone to inconsistent analysis. This indicator automates the process, offering objective, data-driven levels based on statistical price movements.
By providing support and resistance lines across multiple timeframes, traders can make more informed decisions about potential entry and exit points. The adaptive nature of Bollinger Bands ensures that the levels dynamically adjust to changing market conditions.
When to explore it
The indicator is most effective in markets with clear trending or ranging behavior, where price tends to respect support and resistance levels. It works particularly well in liquid markets with consistent volatility, such as major forex pairs, stock indices, and large-cap stocks.
Traders should combine this tool with other technical analysis methods to confirm signals and reduce false positives. It is especially useful for traders seeking a systematic approach to identifying potential price reversal or continuation zones.
Keep exploring
What we’ve verified
Access, alerts and repainting behaviour have not been independently verified for this indicator. Check the creator’s current publication and settings.
General descriptions and classifications are recovered research. Verified details above identify the specific checks we have completed. Check the creator’s current publication for later changes.