
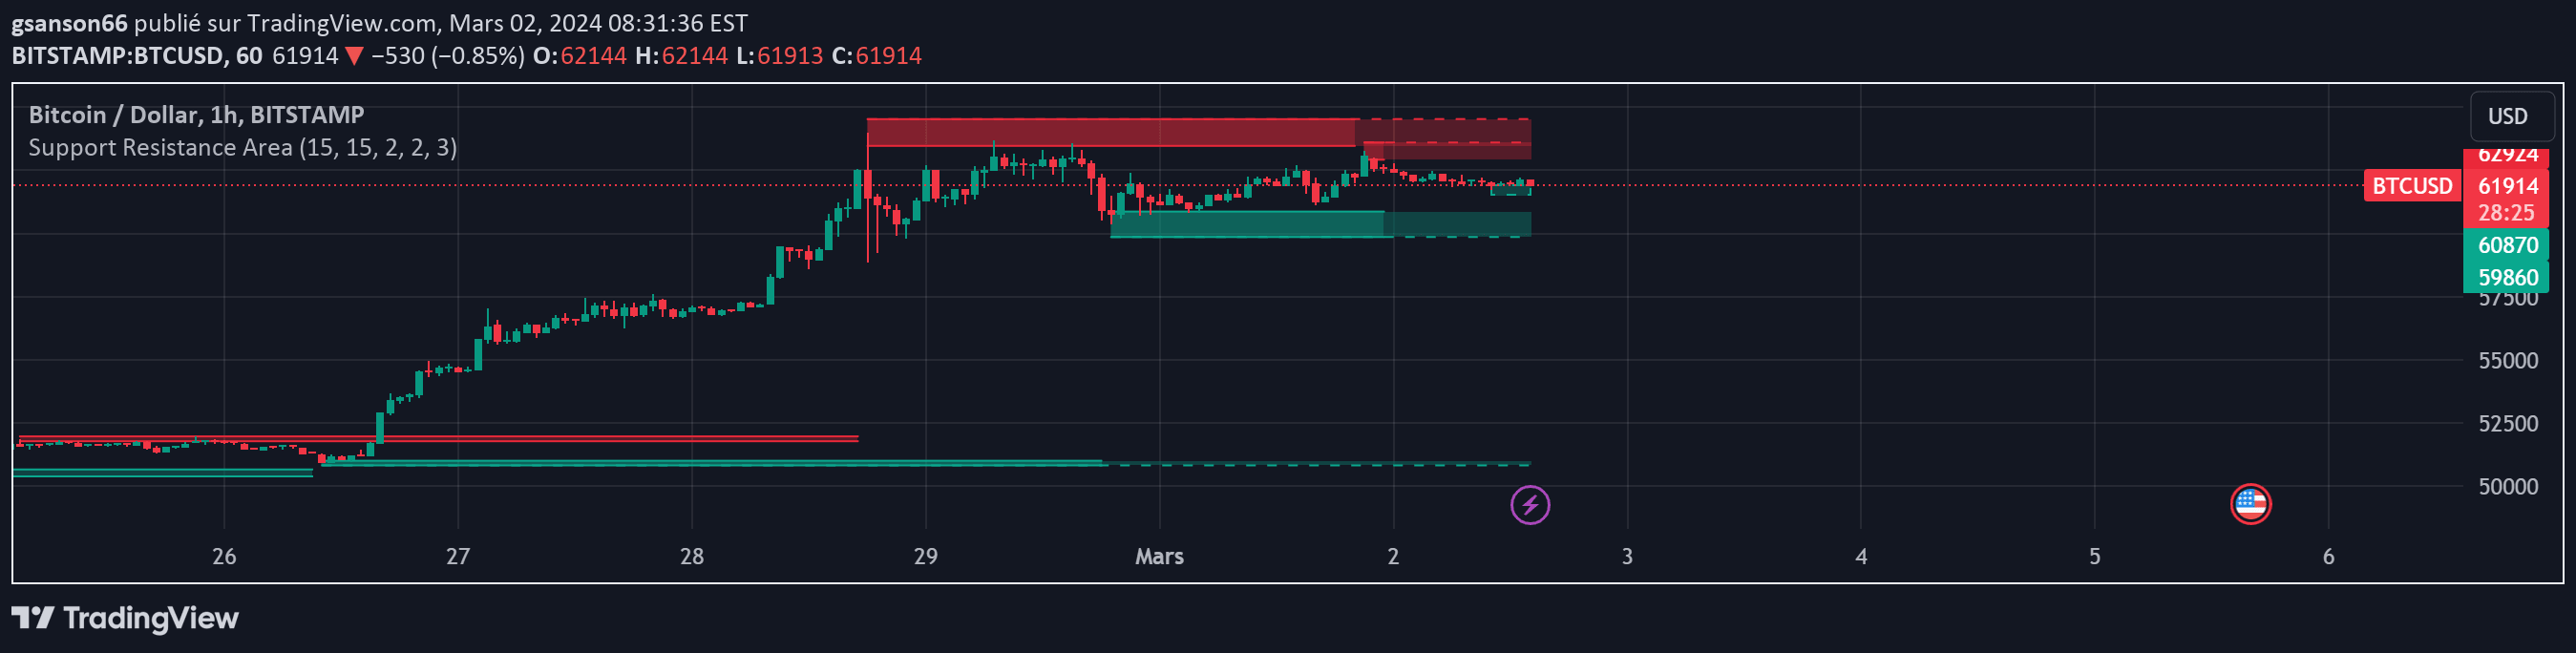
A sophisticated support and resistance indicator that identifies key price zones using pivot points and Average True Range. Helps traders recognize potential market turning points and critical price levels.
Explore complementary indicator rolesHow it works
The indicator identifies pivot points by examining specific candle formations where a high or low point is not exceeded by a predetermined number of candles on both sides. It uses these pivot points to establish potential support and resistance zones, with the width of these zones dynamically calculated using the Average True Range (ATR).
When a pivot high is detected, it is considered a potential resistance zone, while a pivot low is viewed as a potential support zone. The ATR helps determine the zone's width, meaning more volatile assets will have wider support and resistance areas. The indicator can also anticipate future support and resistance levels by adjusting the right pivot leg parameters.
Why it may be useful
Support and resistance zones are critical psychological levels where traders make decisions about entering or exiting trades. By providing dynamic, flexible zones instead of rigid lines, this indicator offers a more nuanced view of potential market turning points.
The use of ATR ensures that the support and resistance zones adapt to current market volatility, making the indicator more responsive and relevant across different market conditions. Traders can use these zones to identify potential entry and exit points, set stop-loss levels, and understand the overall market structure.
When to explore it
This indicator works best in markets with clear trend structures and sufficient volatility. It is particularly useful in trending markets where price tends to respect support and resistance levels, such as in forex, stocks, and commodities trading.
Traders should combine this indicator with other technical analysis tools to confirm signals and reduce false positives. It is most effective when used on timeframes from 5 minutes to daily charts, and can be especially powerful when applied to liquid, high-volume markets that exhibit consistent price behaviors.
Keep exploring
What we’ve verified
Access, alerts and repainting behaviour have not been independently verified for this indicator. Check the creator’s current publication and settings.
General descriptions and classifications are recovered research. Verified details above identify the specific checks we have completed. Check the creator’s current publication for later changes.


