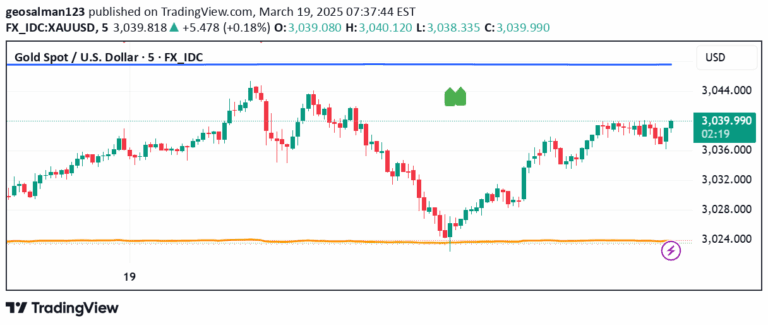
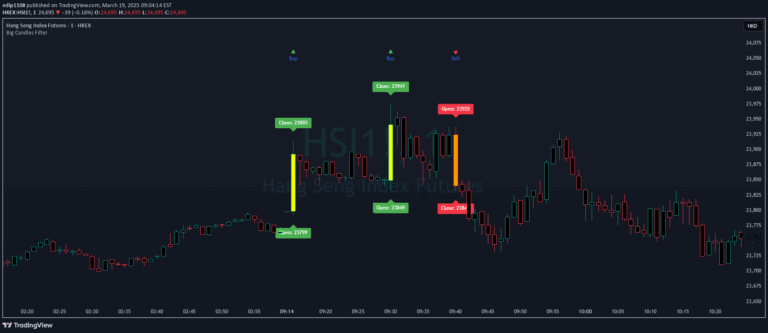
A banker fund model that tracks market trends using moving averages and candle color analysis to identify bullish and bearish market conditions through advanced curve fitting techniques.
Explore complementary indicator rolesHow it works
The banker fund model operates by calculating two exponential moving averages (EMA2 and EMA42) on a specially designed artificial curve fitting line. This curve is created by combining the close price with a slope calculation using the xsl function, which helps determine the underlying price momentum.
The model then defines specific market conditions through color-coded candles and moving average interactions. Green candles represent bullish trends, red candles indicate bearish trends, and a unique yellow candle signals the potential start of a bullish swing, providing traders with visual cues about market direction and potential trend changes.
Why it may be useful
Understanding whale (large fund) movements is crucial in financial markets, especially in cryptocurrency trading where significant players can dramatically influence price dynamics. This model provides traders with a sophisticated method to track and interpret complex market trends through advanced mathematical calculations and visual representations.
By offering a nuanced view of market momentum and potential trend reversals, the banker fund model helps traders make more informed decisions. The color-coded candles and moving average interactions provide clear, intuitive signals that can enhance trading strategies and risk management.
When to explore it
The banker fund model is most effective in markets with significant institutional participation, particularly in cryptocurrency and highly liquid financial markets. Traders can use this signal during periods of potential trend initiation or reversal, where understanding large fund movements becomes critical for successful trading.
The model works best when combined with other technical analysis tools and during timeframes that allow for meaningful trend identification. Day traders and swing traders can particularly benefit from this signal's ability to provide early indications of potential market direction changes.
Keep exploring
What we’ve verified
Access, alerts and repainting behaviour have not been independently verified for this indicator. Check the creator’s current publication and settings.
General descriptions and classifications are recovered research. Verified details above identify the specific checks we have completed. Check the creator’s current publication for later changes.