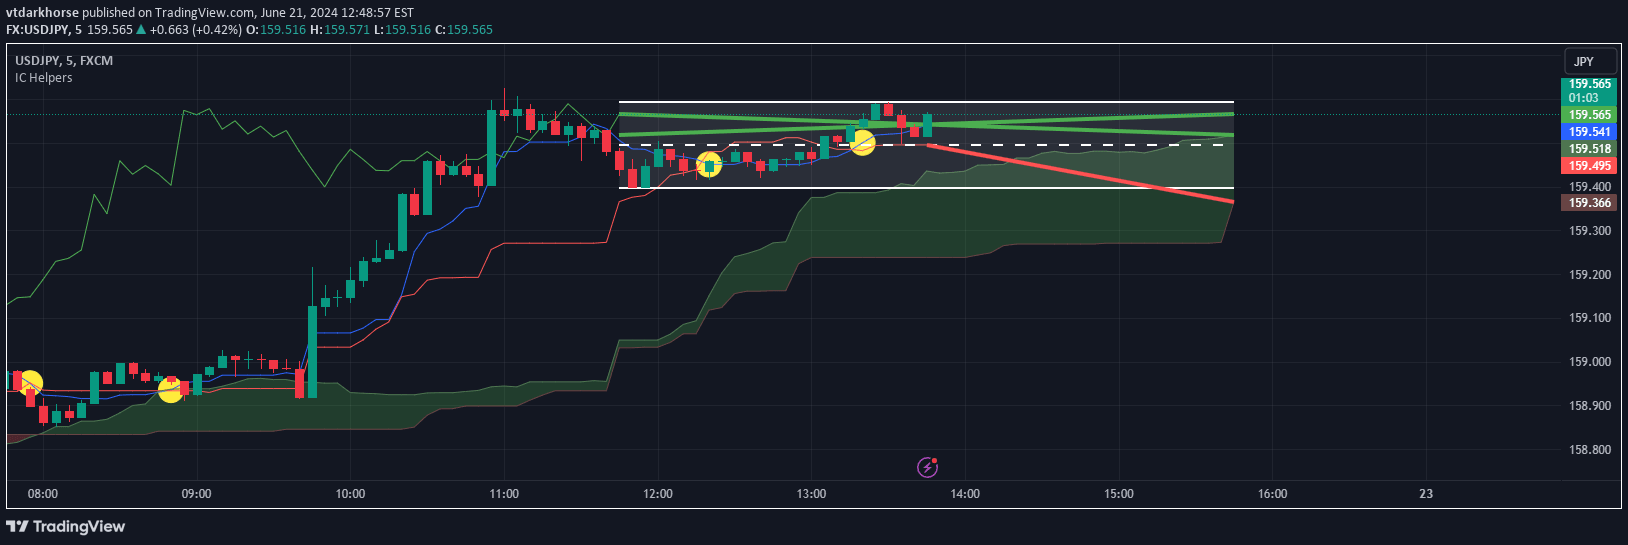
L3 Ichimoku Fusion is an advanced multi-layered technical analysis tool that integrates Japanese market forecasting techniques with dynamic elements to identify potential price turning points and market trends.
Explore complementary indicator rolesHow it works
The L3 Ichimoku Fusion indicator operates by combining traditional Ichimoku components like conversion and base lines with modern enhancements. It tracks intermediate-term averages, uses a lagging span for delayed feedback, and projects future equilibrium states through lead spans.
The system employs a cross-validation protocol that confirms directional bias across multiple independent criteria, reducing random noise and increasing signal reliability. It dynamically adjusts parameters using adaptive scaling, automated labeling, and displacement value controls to optimize responsiveness across different market conditions.
Why it may be useful
The L3 Ichimoku Fusion provides traders with a comprehensive framework for understanding market dynamics by integrating multiple analytical perspectives into a single, intuitive tool. Its sophisticated approach allows for more nuanced market interpretation beyond traditional single-indicator analysis, offering deeper insights into potential price movements.
By combining established Ichimoku principles with advanced technological enhancements, the indicator helps traders make more informed decisions. It reduces emotional trading by providing a structured, multi-layered approach to market analysis that considers various timeframes and market conditions.
When to explore it
The L3 Ichimoku Fusion is most effective in markets with clear trend characteristics, such as forex, futures, and major stock indices. It works best when traders can apply its comprehensive analysis across multiple timeframes, allowing for a holistic view of market dynamics and potential entry/exit points.
Traders should utilize this indicator when seeking a robust, multi-dimensional analysis tool that goes beyond simple trend identification. It is particularly useful during periods of market transition, when traditional indicators might provide less reliable signals, and when traders need a nuanced understanding of potential market turning points.
Keep exploring
What we’ve verified
Access, alerts and repainting behaviour have not been independently verified for this indicator. Check the creator’s current publication and settings.
General descriptions and classifications are recovered research. Verified details above identify the specific checks we have completed. Check the creator’s current publication for later changes.