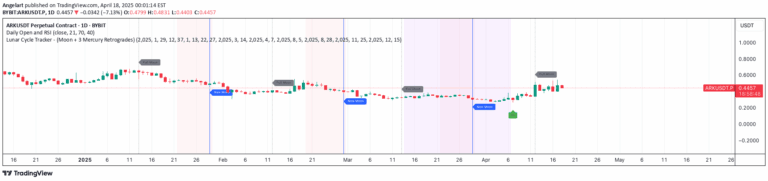
A unique trading indicator that marks total lunar eclipse dates on charts, helping traders visually identify potential correlations between celestial events and cryptocurrency price movements.
Explore complementary indicator rolesHow it works
The Blood Moon Dates indicator automatically plots vertical lines on a trading chart to mark the precise timestamps of total lunar eclipses between December 2010 and May 2040. These lines are strategically drawn on the first bar of each eclipse date and extend across the entire chart, ensuring maximum visibility and easy identification of these celestial events.
Traders can customize the indicator's appearance by adjusting line color, style (solid, dotted, or dashed), and width to suit their visual preferences. The lines can also be toggled on or off, allowing for a cleaner chart view when desired, and are designed to work best on daily or higher timeframes.
Why it may be useful
The Blood Moon Dates indicator provides traders with a unique visual tool for analyzing potential correlations between astronomical events and market movements, particularly in cryptocurrency trading. By marking total lunar eclipse dates, it offers traders an additional perspective for pattern recognition and potential market behavior analysis.
While not a predictive tool, the indicator encourages traders to explore potential relationships between celestial events and market dynamics. It promotes a broader, more holistic approach to market analysis by introducing an unconventional yet intriguing visual element that can spark deeper research and innovative trading strategies.
When to explore it
The Blood Moon Dates indicator is most effective for swing traders and long-term investors who are interested in exploring potential correlations between astronomical events and market movements. It is particularly useful for traders who enjoy comprehensive market analysis and are open to examining unconventional factors that might influence price action.
Traders should use this indicator as a supplementary tool for visual reference and potential pattern recognition, not as a primary trading signal. It works best when combined with other technical and fundamental analysis methods, offering an additional layer of contextual information for market interpretation.
Keep exploring
What we’ve verified
Access, alerts and repainting behaviour have not been independently verified for this indicator. Check the creator’s current publication and settings.
General descriptions and classifications are recovered research. Verified details above identify the specific checks we have completed. Check the creator’s current publication for later changes.