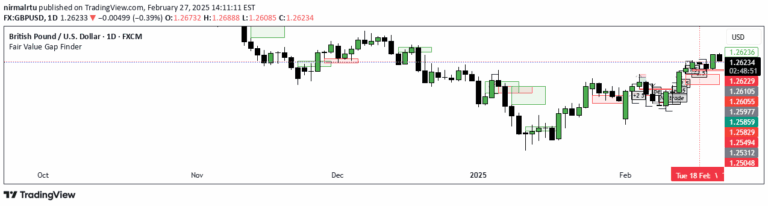
A sophisticated trading indicator that identifies order blocks representing significant institutional price movements, highlighting potential support and resistance zones based on consecutive candle patterns and price changes.
Explore complementary indicator rolesHow it works
The Magic Order Blocks indicator creates a matrix of order blocks filtered by consecutive bullish or bearish candles and price movement in ATRs. It identifies price zones where significant institutional orders have been placed, causing substantial market direction shifts.
The indicator analyzes each order block's characteristics, including consecutive bars, price changes, and average true range movements. It then highlights the most recent bearish order blocks above current price and bullish order blocks below, providing traders with potential support and resistance levels.
Why it may be useful
Order blocks reveal critical areas of institutional trading interest, offering insights into potential market reversals and continuation patterns. By identifying zones where large orders were placed, traders can better understand underlying market dynamics and potential future price movements.
The indicator's multi-dimensional analysis provides deeper context than traditional support/resistance methods, incorporating volume, consecutive candle patterns, and price momentum to validate trading zones.
When to explore it
This indicator is most effective in markets with clear trending characteristics and significant institutional participation. It works best on timeframes ranging from 1-minute to daily charts, with optimal settings varying based on market volatility and asset characteristics.
Traders should use the Magic Order Blocks in conjunction with other technical analysis tools, adjusting parameters to match specific market conditions and trading styles. It's particularly useful for identifying potential entry and exit points in trending markets.
Keep exploring
What we’ve verified
Access, alerts and repainting behaviour have not been independently verified for this indicator. Check the creator’s current publication and settings.
General descriptions and classifications are recovered research. Verified details above identify the specific checks we have completed. Check the creator’s current publication for later changes.