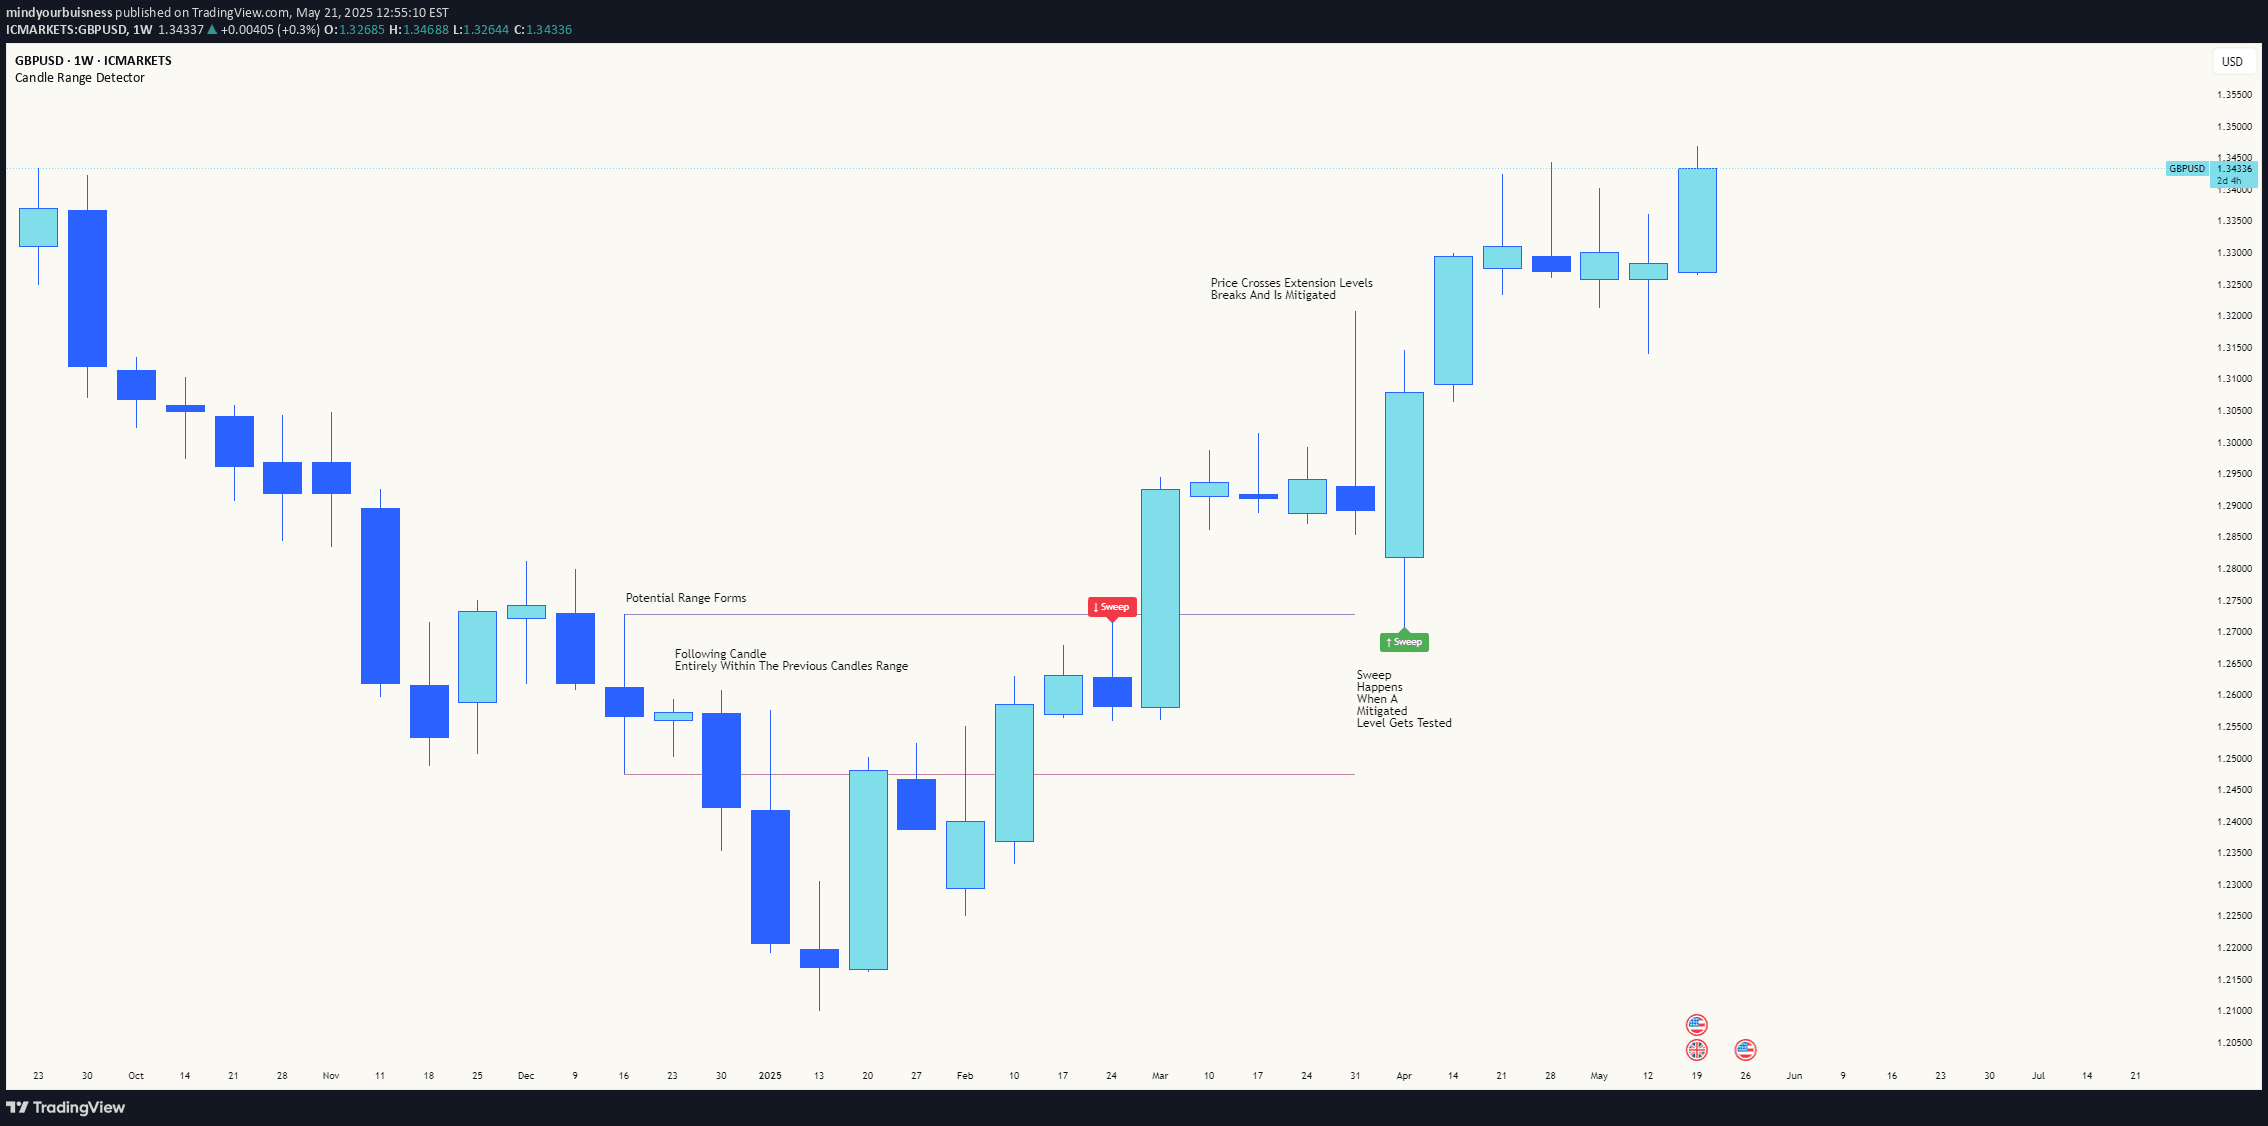
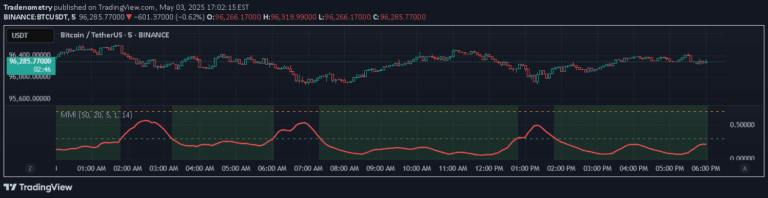
A trading indicator analyzing price ranges during the Basis Trade at Index Close session, identifying key price levels and potential support/resistance zones for future market movements.
Explore complementary indicator rolesHow it works
The indicator focuses on specific trading sessions between 15:15-15:44 ET, capturing and visualizing price ranges through horizontal lines. It plots the high, low, and midpoint of each session, creating a comprehensive view of price movements during this critical trading period.
By storing up to 20 days of historical sessions, the indicator can filter and display ranges close to the current price. It uses color-coding and customizable line styles to help traders quickly identify and interpret different session ranges and their potential significance.
Why it may be useful
This indicator provides traders with a structured approach to understanding price dynamics during the Basis Trade at Index Close session. By highlighting key price levels, it helps traders identify potential support and resistance zones that could influence future market movements.
The visual representation allows traders to quickly recognize patterns and price relationships, potentially improving decision-making and trade entry/exit strategies. Its ability to track multiple historical sessions offers a deeper understanding of recent market behavior and price interactions.
When to explore it
The indicator is most effective when used on 15-minute timeframes or lower, specifically during the Basis Trade at Index Close session. Traders looking to understand short-term price ranges and potential market support/resistance levels will find this tool particularly useful.
It is especially valuable for day traders seeking to identify key price levels and potential trading opportunities within a specific, concentrated time window. The indicator's flexibility in customization and historical data storage makes it adaptable to various trading styles and market conditions.
Keep exploring
What we’ve verified
Access, alerts and repainting behaviour have not been independently verified for this indicator. Check the creator’s current publication and settings.
General descriptions and classifications are recovered research. Verified details above identify the specific checks we have completed. Check the creator’s current publication for later changes.