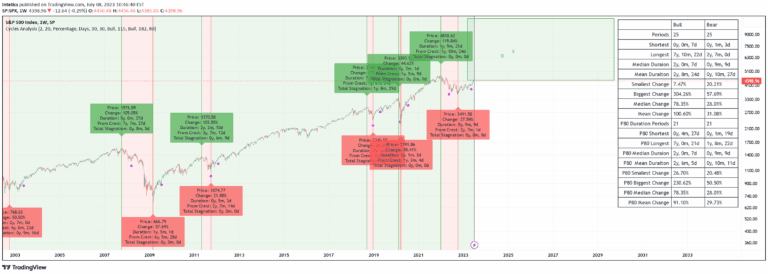
Bull Market Drawdowns script helps traders visualize and analyze market retracements by tracking price declines from highest highs during bullish periods.
Explore complementary indicator rolesHow it works
The script calculates the highest high price from a specified start date and tracks drawdowns during a bull market. It identifies the drawdown starting point and measures the percentage decline from the highest point, creating visual markers for significant price retracements.
The indicator plots drawdown areas with upper and lower boundaries, using semi-transparent colors to highlight market pullbacks. It automatically tracks maximum drawdowns, placing labels on the chart to indicate the extent of price declines and providing traders with a clear visual representation of market performance.
Why it may be useful
Understanding market drawdowns is crucial for managing risk and maintaining perspective during bullish trends. By visualizing price retracements, traders can better assess the potential volatility and potential downside within an overall positive market movement.
The script provides valuable insights into market behavior, helping traders identify critical periods of potential weakness. It transforms complex drawdown calculations into an easy-to-understand visual format, enabling more informed decision-making and strategic planning during bull market conditions.
When to explore it
This indicator is most effective during confirmed bull market periods when traders want to monitor potential pullbacks and assess market risk. It works best when applied to longer-term timeframes where sustained bullish trends can be meaningfully analyzed and understood.
Traders should utilize this tool when evaluating market health, assessing potential entry and exit points, and understanding the magnitude of historical price retracements. It is particularly useful for swing traders and investors looking to gain deeper insights into market dynamics beyond simple price movement.
Keep exploring
What we’ve verified
Access, alerts and repainting behaviour have not been independently verified for this indicator. Check the creator’s current publication and settings.
General descriptions and classifications are recovered research. Verified details above identify the specific checks we have completed. Check the creator’s current publication for later changes.