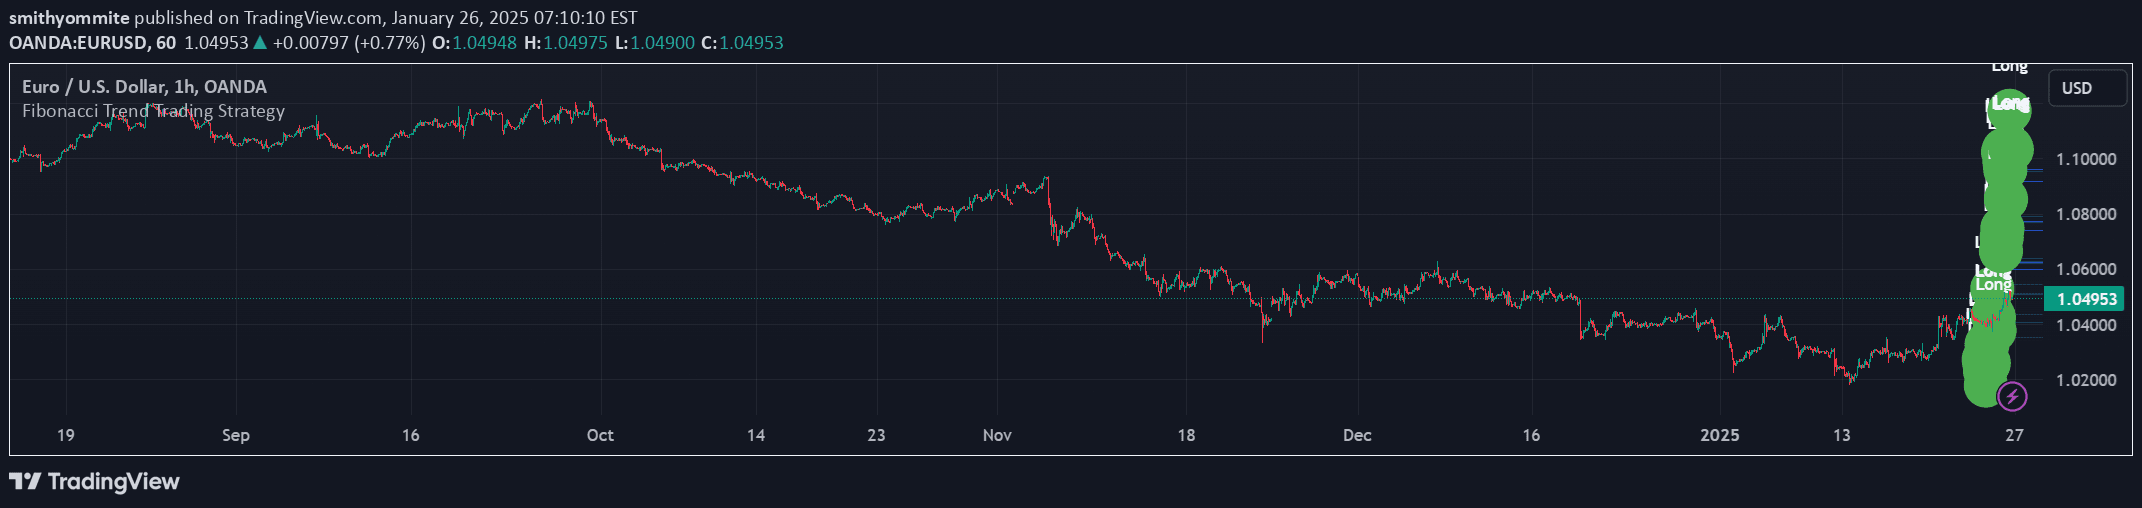
A trading indicator that automatically identifies bullish deep crab harmonic patterns using Fibonacci ratios to project potential price movements and trading opportunities.
Explore complementary indicator rolesHow it works
The deep crab harmonic pattern is a sophisticated trading signal that analyzes price movements through specific Fibonacci ratio measurements across five key points. It tracks wave cycles by identifying swing highs and lows, measuring the relationships between price ranges using precise mathematical calculations.
The indicator automatically plots the pattern by examining the ratios between waves XA, AB, BC, and CD, checking each segment against predefined tolerance levels. By comparing these measurements against Scott Carney's original pattern requirements, the tool can quickly detect and highlight potential trading opportunities within the price chart.
Why it may be useful
Harmonic patterns provide traders with a structured approach to identifying potential market reversals and price projection zones based on mathematical relationships. By utilizing Fibonacci ratios, the deep crab pattern offers a systematic method for recognizing high-probability trading setups that go beyond traditional technical analysis.
The indicator's ability to automatically detect complex price formations helps traders make more informed decisions by highlighting potential entry and exit points. Its flexible tolerance settings allow for increased pattern recognition frequency while maintaining the core mathematical principles of harmonic trading strategies.
When to explore it
The deep crab harmonic pattern works best in markets with clear trending or ranging conditions, particularly in 24-hour markets with minimal price gaps. Traders should preferably apply this indicator on timeframes that provide sufficient historical price data to accurately calculate wave cycles and Fibonacci measurements.
Ideal usage includes confirming potential trend reversals, identifying potential support and resistance zones, and developing precise entry and exit strategies. Traders should combine this indicator with other technical analysis tools to validate signals and manage risk effectively.
Keep exploring
What we’ve verified
Access, alerts and repainting behaviour have not been independently verified for this indicator. Check the creator’s current publication and settings.
General descriptions and classifications are recovered research. Verified details above identify the specific checks we have completed. Check the creator’s current publication for later changes.