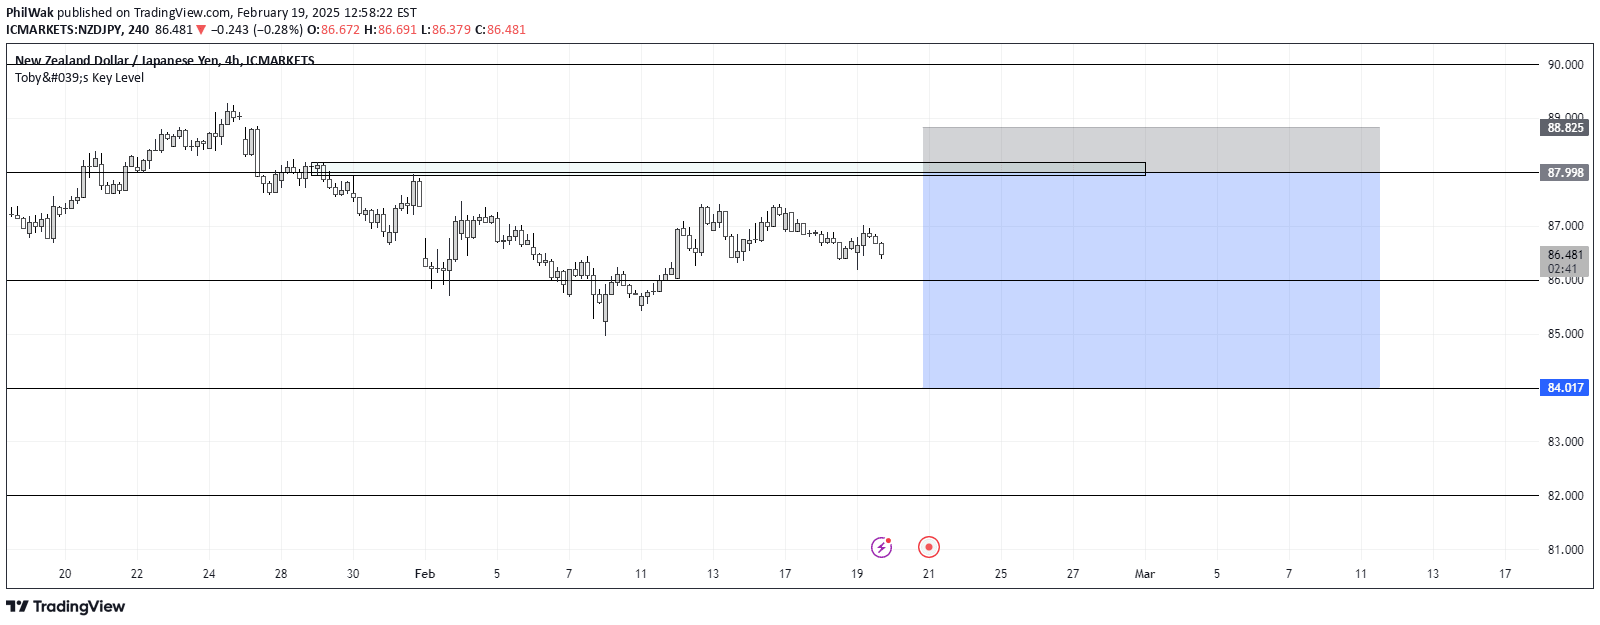
A harmonic trading indicator that automatically identifies bullish Shark patterns using Fibonacci ratios and provides price projections based on specific pattern measurements.
Explore complementary indicator rolesHow it works
The indicator automatically detects and draws bullish Shark harmonic patterns by analyzing price movements and swing highs and lows. It uses a systematic approach to identify specific wave patterns, tracking the relationships between peak and trough prices through precise Fibonacci ratio measurements.
The pattern recognition process involves calculating multiple wave ratios, including AB, BC, and XC measurements. By applying specific tolerance ranges, the indicator increases the frequency of pattern occurrences while maintaining the core structural requirements of the Shark harmonic pattern developed by Scott Carney.
Why it may be useful
Harmonic patterns provide traders with a structured method to identify potential price reversals and predict market movements based on geometric price patterns. By leveraging Fibonacci ratios, the indicator offers a mathematical approach to understanding market psychology and potential trend changes.
The Shark pattern helps traders anticipate price movements by revealing hidden market structures that might not be immediately apparent through traditional technical analysis. It provides a systematic framework for identifying potential entry and exit points with predefined ratio measurements.
When to explore it
The Shark pattern indicator works best in markets with clear trending characteristics and sufficient price volatility. It is most effective when applied to 24-hour markets with minimal price gaps, allowing for more accurate pattern recognition and ratio calculations.
Traders should use this indicator in conjunction with other technical analysis tools to confirm signals and validate potential trading opportunities. It is particularly useful for identifying potential trend reversals and measuring the strength of price movements across different timeframes.
Keep exploring
What we’ve verified
Access, alerts and repainting behaviour have not been independently verified for this indicator. Check the creator’s current publication and settings.
General descriptions and classifications are recovered research. Verified details above identify the specific checks we have completed. Check the creator’s current publication for later changes.