
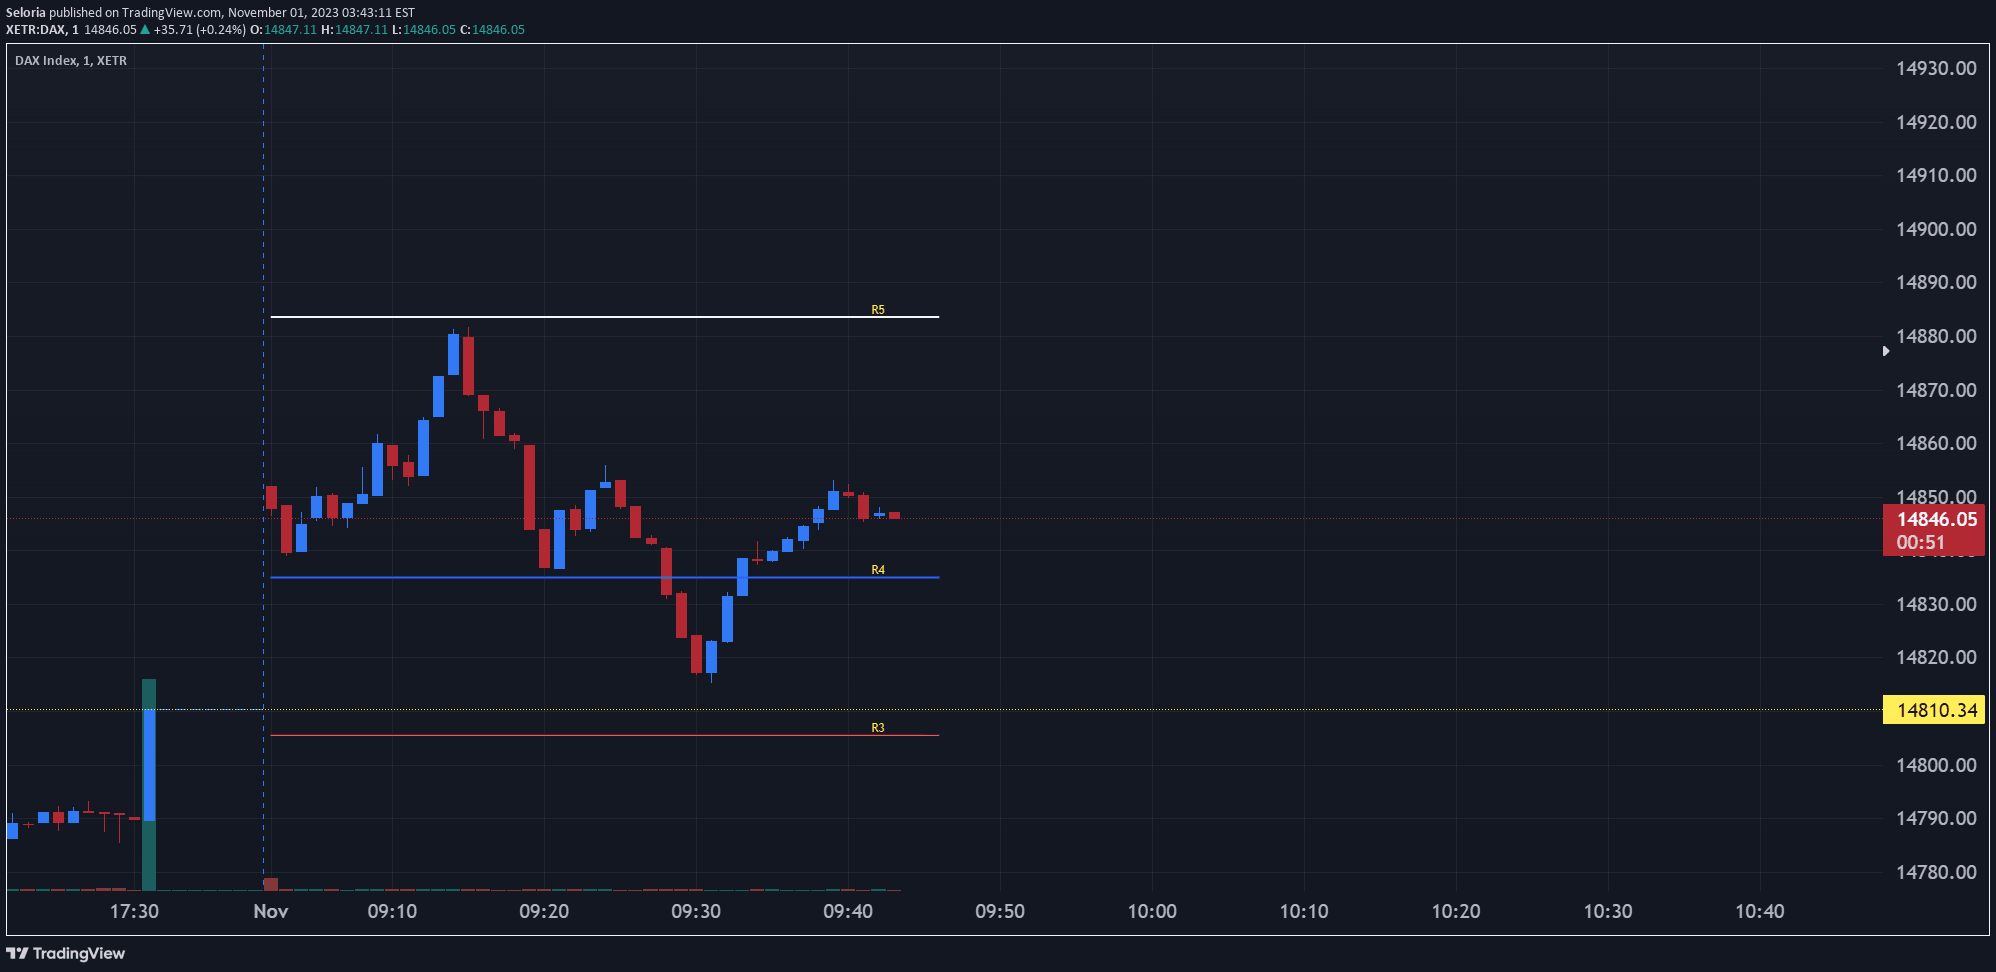
Heikin-Ashi Camarilla levels indicator that plots key market levels and alerts traders when price approaches these significant zones, helping identify potential trading opportunities.
Explore complementary indicator rolesHow it works
The Heikin-Ashi Camarilla levels indicator combines two sophisticated technical analysis techniques to create a unique price mapping system. It uses modified Heikin-Ashi candlesticks, which smooth price action and filter out market noise, alongside Camarilla pivot point calculations that define precise support and resistance levels.
The indicator plots these levels directly on the chart, creating a visual framework of potential market turning points. Traders can see predefined price zones that might trigger potential entry, exit, or stop-loss points, allowing for more strategic decision-making based on these mathematically derived levels.
Why it may be useful
Camarilla levels provide traders with a structured approach to understanding market dynamics by identifying key price zones where significant market movements might occur. These levels help traders anticipate potential reversals, breakouts, or consolidation areas, reducing emotional trading and providing a more systematic approach to market analysis.
By integrating Heikin-Ashi's smoothing technique, the indicator offers enhanced clarity in trend identification and market sentiment. Traders gain a more nuanced view of price action, helping them make more informed decisions about market entry and exit points with greater statistical precision.
When to explore it
The Heikin-Ashi Camarilla levels indicator is most effective in volatile and range-bound markets where clear support and resistance levels can provide meaningful trading signals. It works particularly well in intraday and short-term trading scenarios, where quick identification of potential price zones is crucial for making rapid trading decisions.
Traders should use this indicator in conjunction with other technical analysis tools to confirm signals and validate potential trade setups. It is especially useful during periods of market uncertainty, helping traders navigate complex price movements and identify high-probability trading opportunities with improved risk management.
Keep exploring
What we’ve verified
Access, alerts and repainting behaviour have not been independently verified for this indicator. Check the creator’s current publication and settings.
General descriptions and classifications are recovered research. Verified details above identify the specific checks we have completed. Check the creator’s current publication for later changes.


