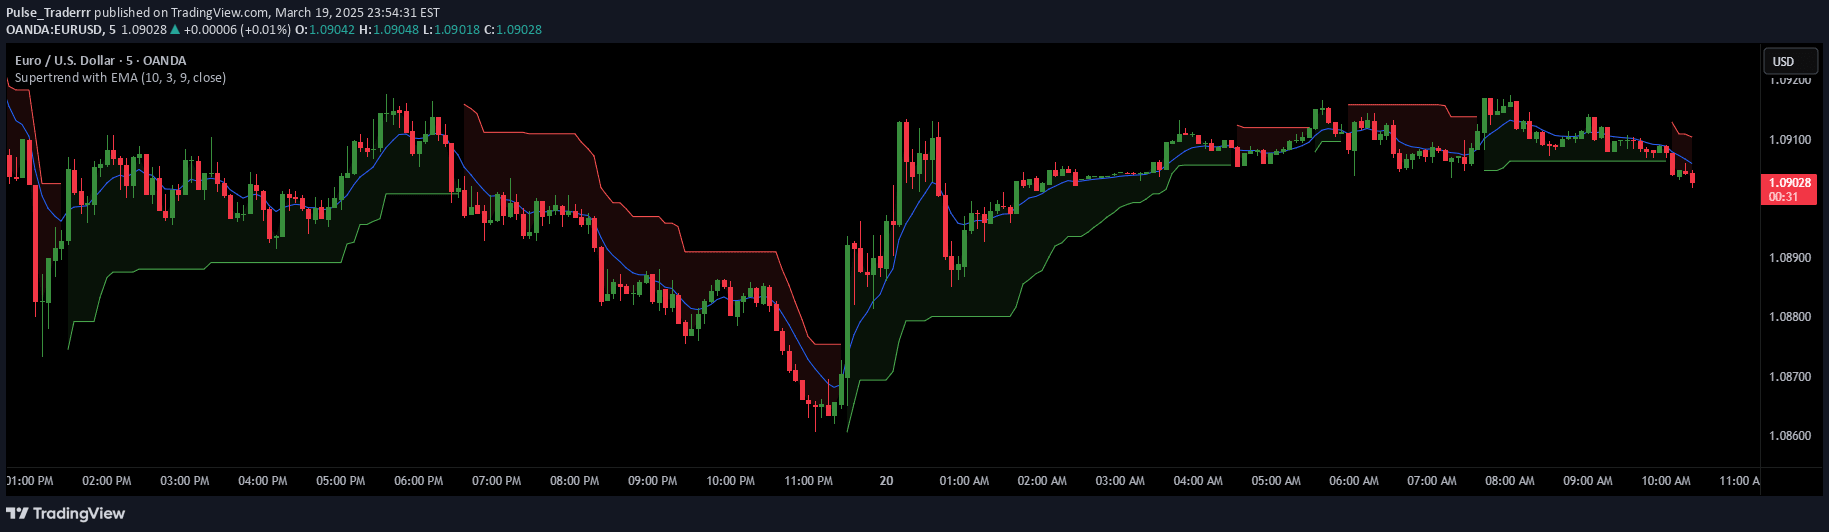
A candle and EMA coloring indicator that visually represents price position relative to two exponential moving averages, providing quick trend and momentum insights.
Explore complementary indicator rolesHow it works
The indicator dynamically colors candlesticks and exponential moving averages (EMAs) based on the relationship between price and the moving averages. When the closing price is above the first EMA, the candle turns green, signaling bullish momentum. If the price falls between two EMAs, the candle becomes gray, indicating a potential consolidation phase.
When the closing price drops below the second EMA, the candle transforms to red, suggesting bearish sentiment. Similarly, the EMAs themselves change color based on price position, with green indicating price is above the moving average and red signaling price is below, providing traders with an intuitive visual representation of market trend.
Why it may be useful
This indicator offers traders an immediate visual interpretation of market trend and momentum without requiring complex calculations or multiple chart elements. By color-coding candles and EMAs, it simplifies trend identification and helps traders quickly assess market sentiment at a glance.
The visual nature of the indicator reduces cognitive load, allowing traders to make faster decisions about potential entry and exit points. Its adaptable color scheme and customizable EMA periods make it a versatile tool that can be tailored to different trading styles and market conditions.
When to explore it
The indicator is most effective in trending markets where price shows clear directional movement between moving averages. It works particularly well for short-term trading strategies like scalping and day trading, where quick trend identification is crucial for making rapid trading decisions.
Traders should use this indicator in conjunction with other technical analysis tools to confirm signals and reduce false positives. It is especially useful in markets with moderate volatility, where price movements are consistent enough to generate meaningful color changes in candles and EMAs.
Keep exploring
What we’ve verified
Access, alerts and repainting behaviour have not been independently verified for this indicator. Check the creator’s current publication and settings.
General descriptions and classifications are recovered research. Verified details above identify the specific checks we have completed. Check the creator’s current publication for later changes.