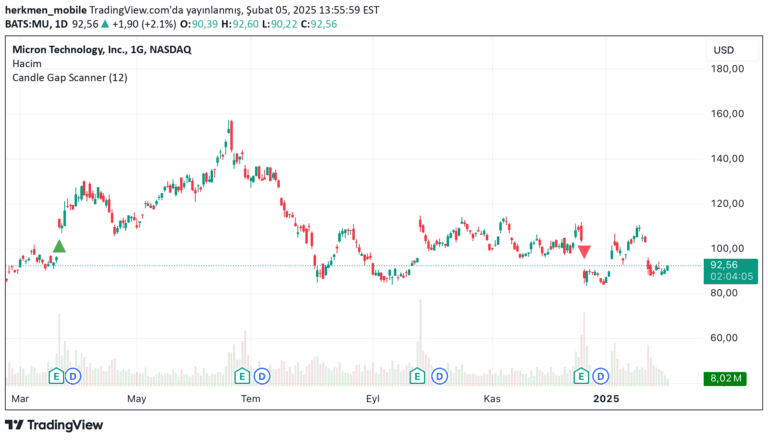
A market gap indicator that identifies price areas with no previous trading activity, highlighting potential trading opportunities by marking and tracking these unique market spaces.
Explore complementary indicator rolesHow it works
The gap indicator identifies market spaces where no prior price action exists by analyzing consecutive candlesticks. It creates visual boxes representing gaps when a candle's close is above or below the previous candle's high or low, effectively marking areas of price discontinuity.
These gaps are drawn with a specific color and extend indefinitely to the right side of the chart. The indicator automatically tracks and removes these gap markers once price action crosses or 'fills in' the marked area, ensuring dynamic and real-time visualization of market movement.
Why it may be useful
Gap analysis provides traders with a unique perspective on market dynamics by highlighting areas of sudden price movement and potential market inefficiencies. These gaps can serve as critical confluence points for various trading strategies, offering insights into market sentiment and potential future price action.
By visually representing these market spaces, traders can quickly identify potential entry and exit points, understand market momentum, and make more informed trading decisions. The indicator helps traders recognize market structure and potential price continuation or reversal zones.
When to explore it
This gap indicator is most effective in markets with clear price movements and distinct candlestick patterns, such as stocks, forex, and cryptocurrencies. Traders can utilize it during periods of high market volatility when price gaps are more likely to occur and provide meaningful trading signals.
It works best when combined with other technical analysis tools to confirm potential trading opportunities. Traders should pay special attention to gaps in trending markets, as they can indicate strong momentum and potential future price direction.
Keep exploring
What we’ve verified
Access, alerts and repainting behaviour have not been independently verified for this indicator. Check the creator’s current publication and settings.
General descriptions and classifications are recovered research. Verified details above identify the specific checks we have completed. Check the creator’s current publication for later changes.